Monthly Archives: January 2018

It (Still) Doesn’t Have to be Rocket Science

We live in interesting times.  All the buzz these days seems to revolve around a technology (Blockchain) of which most people don’t have the slightest idea how it works, and a trading vehicle (crytocurrencies, particularly Bitcoin) that most people don’t have the slightest idea what it is.  Speaking of buzz, legal marijuana appears to be pretty popular among people with whom marijuana is pretty popular.

I myself am attempting to develop a hybrid technology (Potchain technology) to tap into these manias, er, I mean “sound investment opportunities.”  Now the truth is that I don’t really know how this new technology of mine will work or what it is supposed to do.  So there is not much point in toking, er, talking about it at length at this time.  Still, I am thinking that if I can just tap into the “stoned Bitcoin trader” market – at least while they still have some money to  spend – well, enough about all of that for now.

Also, please remember that I have still  have plenty of JCoins available for speculative purchase if anyone is interested.  You can buy all of the JCoins you’d like on JBay.com and pay for them on JayPal.com.  But (ironically) I don’t accept JCoins as a form of payment because, well, what would be the point of that?

Anyway….

Meanwhile Back in Squaresville

“Jay’s Vanguard System” below is one I have followed for many years. It is really boring. Also the returns (and rewards versus risk) are probably in the range that most would quantify as “Good, Not Great.”  But I am OK with that.

The “System” (such as it is) involves holding a particular Vanguard fund during a particular month, as shown below.

1

Figure 1 – “Jay’s (Boring) Vanguard System”

There are 3 stages:

Boring: Vanguard Equity-Income Fund Investor Shares during March, April and May

Boring”er”: Vanguard Wellesley Income Fund Investor Shares during November through February

Boring”est”: Vanguard GNMA Fund Investor Shares (June through October)

For the record, Vanguard is pretty militant about “switching” but the shortest holding period is three months so as long you’re not switching billions of dollars there are (to date) no hassles.

Figure 2 displays the growth of $1,000 invested since 1980 using the “System” versus Buy and Hold.2Figure 2 – Growth of $1,000 using “Jay’s Vanguard System” versus buying and holding the 3 funds used in the System (Data Source: Monthly Total Return data from PEP Database from Callan Associates); Jul 1980-Dec 2017

Performance data appears in Figure 3:

  System BuyHold
Average 12 mo% +12.9% +9.3%
Median12 mo% +11.9% +7.8%
Std Deviation % 8.2% 7.0%
Ave/Std Dev 1.58 1.32
Worst 12mo% (-4.2%) (-5.7%)
Max Drawdown% (-9.3%) (-6.7%)
$1,000 becomes $77,446 $23,766

Figure 3 – Performance Figures – “System” versus “Buy/Hold”; Jul 1980-Dec 2017

Summary

Is this a great, “world-beater” system?  Not at all. But for that seemingly ever smaller pool of investors of the “slow and steady” variety, it might be of interest.

Jay Kaeppel

Disclaimer:  The data presented herein were obtained from various third-party sources.  While I believe the data to be reliable, no representation is made as to, and no responsibility, warranty or liability is accepted for the accuracy or completeness of such information.  The information, opinions and ideas expressed herein are for informational and educational purposes only and do not constitute and should not be construed as investment advice, an advertisement or offering of investment advisory services, or an offer to sell or a solicitation to buy any security.


Jay Kaeppel is New “Explore Your Options” Columnist for Technical Analysis of Stocks & Commodities Magazine

Starting with the January 2018 issue, veteran trader and author Jay Kaeppel is the Editor of the monthly “Explore Your Options” column for Technical Analysis of Stocks & Commodities magazine.

Jay brings over 30 years of experience as a trader, author, systems developer and money manager to a column devoted to helping individual traders and investors more knowledgeable and more effective successful in the realm of options trading.

Jay Kaeppel is Director of Research/Vice President and a Portfolio Manager for an Ohio based investment firm and the Editor of the JayontheMarkets.com blog.  He was the Head Trader at a CTA for 9 years and a trading software developer for 15 years.  As an author, Jay has published two books on option trading – The Four Biggest Mistakes in Option Trading and The Option Trader’s Guide to Probability, Volatility and Timing.  Jay spent 9 years as an Instructor and Trading Strategist for Optionetics., Inc.  He has been a Contributing Editor for Schwab.com, has written over 25 articles for Technical Analysis of Stocks and Commodities magazine and his writings are syndicated on Investing.com, WallStreetCurrents.com and The McVerryReport.  Jay was nominated for membership in The American Association of Professional Technical Analysts (AAPTA) in 2006.

Meanwhile, Metals

Poor, poor precious metals.  Once the darlings of speculators everywhere, precious metals and stocks of companies who mine those metals are seemingly being tossed to the curb as the speculation world focuses all of its attention on Bitcoin and roughly a bazillion other “cryptocurrencies” (question of the day: If you cannot explain out loud in a sentence or two what a cryptocurrrency is then why are you trading it?).

Things have gotten so carried away I am contemplating changing the blog name to “CryptoJayontheBlockchaintechnologyMarkets.com” in an effort to increase readership.  Also, if anyone interested in speculating in some of the JCoins I just created in my basement please feel free to make me an offer.

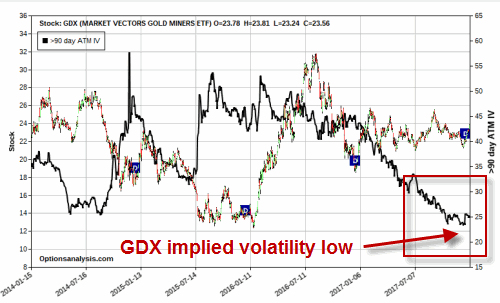
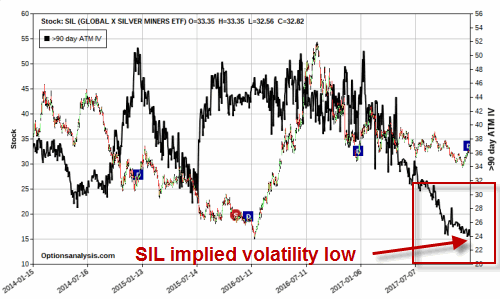
Anyway, Figures 1athrough 1d display bar charts for GLD (gold ETF), SLV (silver ETF), GDX (gold stock ETF) and SIL (silver stock ETF).  Note the current status of implied volatility for options on each – low, lower, lowest; i.e., traders have lost a lot of interest in these ETFs as speculative vehicles.

0

Figure 1a – GLD (Gold ETF) with implied volatility (Courtesy ProfitSource by HUBB)

0b

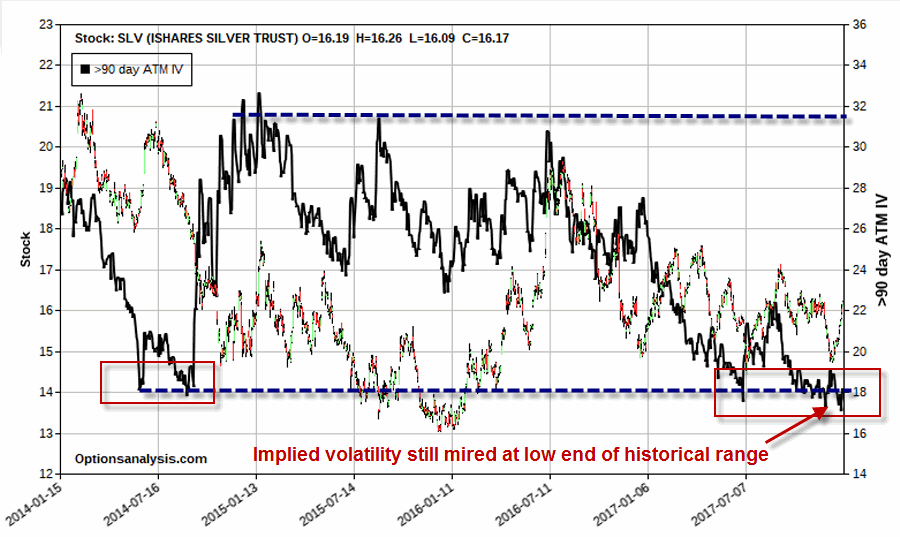
Figure 1b – SLV (Silver ETF) with implied volatility (Courtesy ProfitSource by HUBB)0c

Figure 1c – GDX (Gold stock ETF) with implied volatility (Courtesy ProfitSource by HUBB)0d

Figure 1d – SIL (Silver stock ETF) with implied volatility (Courtesy ProfitSource by HUBB)

Let’s take a closer look at silver.

Ticker SLV

In this article dated 11/17/2017 I “predicted” that “something” was about to happen in silver.  And it did.  SLV immediately plummeted lower – then reversed course and made it all back and is roughly unchanged from where it was at the time of the original article (which explains why I don’t bother making a lot of “predictions”).  So is there any future for silver?

In Figure 2 we see that SLV appears to be “coiling” into an ever tighter range.  There is a good chance that this will continue for at least a little while.

1Figure 2 – SLV “coiling” (Courtesy ProfitSource by HUBB)

While the range in Figure 2 looks pretty wide, in reality, it is not necessarily so as we see in Figure 3 which highlights the same pattern but with much more historical data.2Figure 3 – The same SLV “coil” from a longer-term perspective (Courtesy ProfitSource by HUBB)

Where to from here?  I am probably not the guy to ask.  In the original article linked above I highlighted a bullish example trade – and SLV immediately plummeted for days on end.  Still, for what it is worth, the weekly Elliott Wave count from ProfitSource by HUBB for SLV is suggesting that a 5-wave down pattern may have been completed.  In theory anyway, this should be followed by a move higher.  We’ll see about that, but for now it at least provides a nice support area as shown in Figure 4.3Figure 4 – Weekly Elliott Wave count for SLV (Courtesy ProfitSource by HUBB)

In the original article I highlighted an example bullish trade using options on SLV and a strategy known as a “backspread”.  This trade involved selling 1 June2018 11 strike price call and buying 5 June 2018 16 strike price calls. You can see the current status (basically unchanged) and the risk curves for this trade in Figure 5.4Figure 5 – SLV backspread risk curves (Courtesy www.OptionsAnalysis.com)

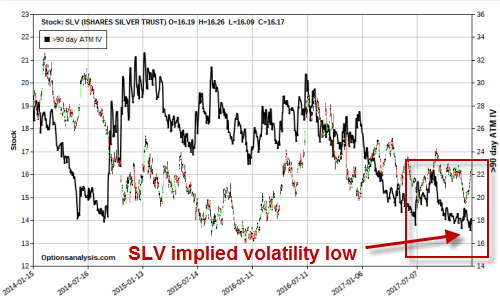
As I mentioned above the current level of implied volatility for options on metals and metals miners are historically low.  This tells us two things, 1) traders have very low expectations for the likelihood that any of these securities will move significantly anytime soon, 2) options on these ETFs are “cheap” (i.e., low implied volatility means there is relatively little time premium built into the price of the options).5Figure 6 – SLV implied volatility extremely low (Courtesy www.OptionsAnalysis.com)

For a trader willing to “take a flyer” on the contrarian possibility that:

*SLV will  make a significant price move to the upside sometime in the next year and/or;

*That implied volatility will increase sometime during the next year

One inexpensive speculative play would be to buy the January 2019 16 strike price call as displayed in Figure 7. To buy 1-lot of this option with 380 days left until expiration costs $166.

6Figure 7 – SLV January 2019 call option (Courtesy www.OptionsAnalysis.com)

As always, I am not “recommending” this trade.  It serves simply as one relatively low dollar cost way to speculate on a price move higher by SLV in the coming 12 months.

Summary

It would seem that the “cryptocraze” has sucked all of the oxygen out of the other traditional “speculative” space traditionally occupied by precious metals and metals miners.  And the reality is that this may continue for some time.  But if history is a guide, at some point precious metals will break out of their respective extended trading ranges and offer some speculative trading opportunities.

Hence, alert traders should remain – well, alert.

Jay Kaeppel

Disclaimer:  The data presented herein were obtained from various third-party sources.  While I believe the data to be reliable, no representation is made as to, and no responsibility, warranty or liability is accepted for the accuracy or completeness of such information.  The information, opinions and ideas expressed herein are for informational and educational purposes only and do not constitute and should not be construed as investment advice, an advertisement or offering of investment advisory services, or an offer to sell or a solicitation to buy any security.
The Biotech-Gold Stock Connection

At first blush there might not seem to be much to connect biotech stocks and gold stocks.

One type of company hires people to engage in high tech biomedical engineering in order to develop potentially life-saving – or at least, life altering – medical breakthroughs…

…while the other hires people to (essentially) dig holes in the ground and mine stuff (granted, valuable stuff, but stuff mined out of the ground nevertheless).

But there is one other connection – stocks of both categories are quite volatile. And that alone may be enough to create a potential opportunity.

The BioGold Index

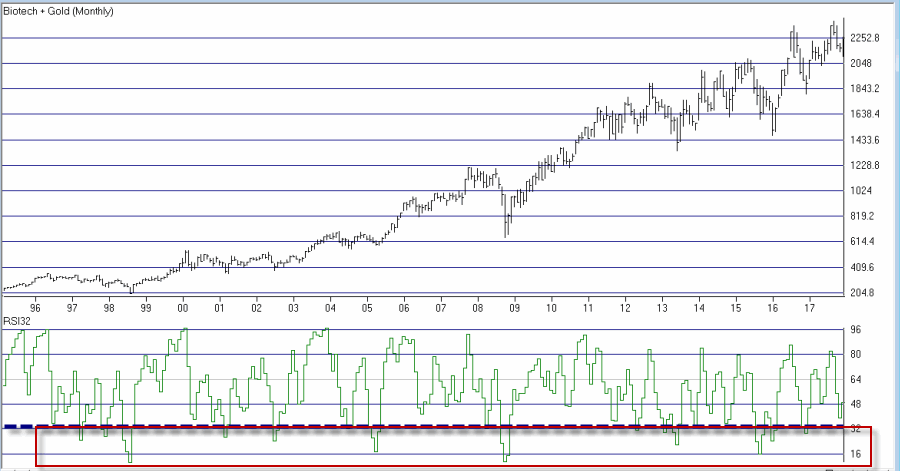
I created an “index” (such as it is) that combines Fidelity Select Biotech (FBIOX) and Fidelity Select Gold (FSAGX).  The index appears in Figure 1.  Like every other index in the world this index fluctuates up and down.1Figure 1 – Jay’s BioGold Index (Courtesy AIQ TradingExpert)

The RSI32 Index

The RSI32 Index is simply a 2-day average of the standard 3-day RSI Index.  The code for AIQ TradingExpert is below:

Define days3 5.

U3 is [close]-val([close],1).

D3 is val([close],1)-[close].

AvgU3 is ExpAvg(iff(U3>0,U3,0),days3).

AvgD3 is ExpAvg(iff(D3>=0,D3,0),days3).

RSI3 is 100-(100/(1+(AvgU3/AvgD3))).

RSI32 is simpleavg(RSI3,2).

The RSI32 Index for the BioGold Index appears on the monthly bar chart in Figure 2.2aFigure 2 – The BioGold Index with RSI32 (drop to 33 or below = BUY) (Courtesy AIQ TradingExpert)

The BioGold “System”

The BioGold System works as follows:

*When the monthly RSI32 Index drops to 33 or lower, buy BOTH FBIOX and FSAGX

*After a “Buy Signal” then when the monthly RSI32 rises to 64 or higher, sell BOTH FBIOX and FSAGX

For testing purposes we will use monthly total return data for both FBIOX and FSAGX from the PEP Database from Callan Associates.

The Results

Figure 3 displays the results of the buy signals generated using the rules above (assumes that both FBIOX and FSAGX are bought after monthly RSI32 drops to 33 or lower and are held until monthly RSI32 rises to 64 or higher.

Buy Signal Sell Signal FBIOX+FSAGX % +(-)
4/30/1992 12/31/1992 +14.4%
2/26/1993 4/30/1993 +14.7%
4/29/1994 9/30/1994 +7.2%
12/30/1994 4/28/1995 +9.8%
4/30/1997 9/30/1997 +18.4%
11/28/1997 4/30/1998 +10.4%
6/30/1998 12/31/1998 +16.1%
3/30/2001 6/29/2001 +22.7%
7/31/2002 12/31/2002 +18.1%
7/30/2004 10/29/2004 +11.2%
3/31/2005 7/29/2005 +10.2%
4/30/2008 7/31/2008 +9.4%
9/30/2008 6/30/2009 +3.8%
5/31/2012 9/28/2012 +20.0%
2/28/2013 2/28/2014 +28.6%
8/31/2015 4/29/2016 +22.2%
12/30/2016 2/28/2017 +13.2%
Average % +14.7%
Median % +14.4%
Std. Deviation % 6.4%
Max % +(-) +28.6%
Min % +(-) +3.8%

Figure 3 – Trade-by-Trade Results

For the record, the “System” has been in FBIOX and FSAGX only 28% of the time (88 months) and out of the market 72% of the time (223 months).

Figure 4 displays the trades in recent years.3Figure 4 – BioGold System trades; 2012-2017 (Courtesy AIQ TradingExpert)

*The Good News is that all 17 signals since 1992 showed a profit, with an average gain if +14.7%.

*The Bad News is that, a) 17 trades in 25 years is a pretty small number of trades and, b) there are some not insignificant drawdowns along the way (-22.8% in 1998 and -22.4% in 2008, -14.1% in 2013 and -13.6% in 2016).

Still, for what it is worth the monthly equity curve appears in Figure 5.4Figure 5 – Growth of $1,000 invested using the “BioGold System”; 12/31/1991-12/29/2017

For the record, the “System” has been in FBIOX and FSAGX only 28% of the time (88 months) and out of the market 72% of the time (223 months).

For the record, the “System” has been in FBIOX and FSAGX only 28% of the time (88 months) and out of the market 72% of the time (223 months).  No interest is assumed to be earned while out of the market in the test above.

If we invest in short-term treasuries (1-3 yr.) while not in the stock market we get the results shown in Figure 6.

In Figure 6:

*The blue line represents the growth of $1,000 achieved by holding FBIOX and FSAGX when the BioGold System is on a “buy signal” and 1-3 yr. treasuries the rest of the time.

*The red line represents the growth of $1,000 achieved by buying and holding both FBIOX and FSAGX and then rebalancing at the end of each year.

The “System” grew to $19,863 and the “split” grew to $12,844.5Figure 6 – Growth of $1,000 using BioGold System plus 1-3 yr. treasuries when out of stocks (blue) versus buying and holding FBIOX and FSAGX and rebalancing each year (red);12/31/1991-12/29/2017

Summary

So is the “BioGold System” really a viable investment idea?  That’s not for me to say.  The per trade returns are pretty good but there aren’t a whole lot of trades and if history is a guide an investor would likely have to ride some significant drawdowns in order to reap the gains.

Still, market-beating performance is market-beating performance, so who knows?

 Jay Kaeppel

Disclaimer:  The data presented herein were obtained from various third-party sources.  While I believe the data to be reliable, no representation is made as to, and no responsibility, warranty or liability is accepted for the accuracy or completeness of such information.  The information, opinions and ideas expressed herein are for informational and educational purposes only and do not constitute and should not be construed as investment advice, an advertisement or offering of investment advisory services, or an offer to sell or a solicitation to buy any security.