Crude oil has surprised a lot of people by rallying quite strongly through the winter months (ironically, October into December is typically a period of weakness for the gooey stuff).
As you can see in Figure 1, crude oil futures are at a key resistance level. In Figure 2 we see that ticker USO – an ETF that purports to track the price of crude oil is also at a key price level. Figure 1 – Crude Oil futures at a key level (Courtesy ProfitSource by HUBB)
 Figure 2 – USO ETF at a key level (Courtesy ProfitSource by HUBB)
Will crude break through and rally to higher new highs? Or will it bump its head on resistance and fall back? Here is where a skilled analyst would insert his or her spot on analysis of why crude oil is destined to do one or the other. Unfortunately, there’s no one like that here on staff. Which is OK because this blog is not intended to give advice or make specific recommendations, only “education”. So let’s look at an “example” of one “cheap” way to trade crude oil assuming you have a particular outlook on crude oil.
Playing for an Upside Breakout
For the record I am making no “predictions” about crude oil. However, for example’s sake let’s say that a trader wants to enter a position that will allow him or her to profit if crude oil continues to rally. Let’s also assume that this trader does not want to risk alot of money.
For the average trader the obvious play would be to buy 100 shares of USO. At $12.57 a share you would need to put up $1,257 to enter the trade. The risk curve for this trade is a straight line as shown in Figure 3. For each $1 in price USO rises the positions gains $100 and vice versa. Figure 3 – Risk graph for long 100 shares of USO at $12.57 (Courtesy www.OptionsAnalysis.com)
Now let’s look at an alternative trade. This one cost $74 to enter. The strategy is referred to as a “Vertical Calendar Spread” and involves:
*Buying 4 USO Mar 13 calls @ $0.23
*Selling 3 USO Feb 13.5 calls @ $0.06
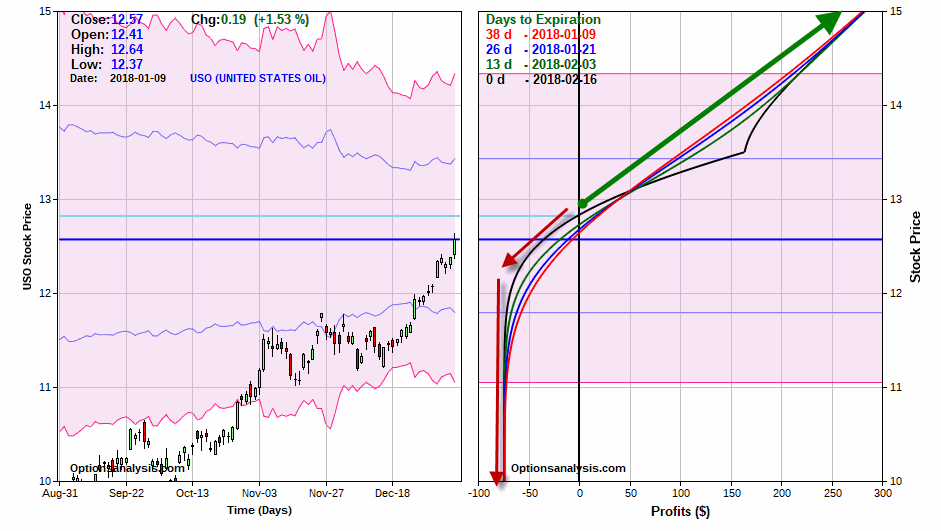
As you can see in Figures 4 and 5 the cost to enter – and maximum risk – is $74. Profit potential is unlimited and the breakeven price is $12.82 a share. Figure 4 – Vertical Calendar Spread (Courtesy www.OptionsAnalysis.com)
 Figure 5 – Risk Curves for USO Vertical Calendar Spread (Courtesy www.OptionsAnalysis.com)
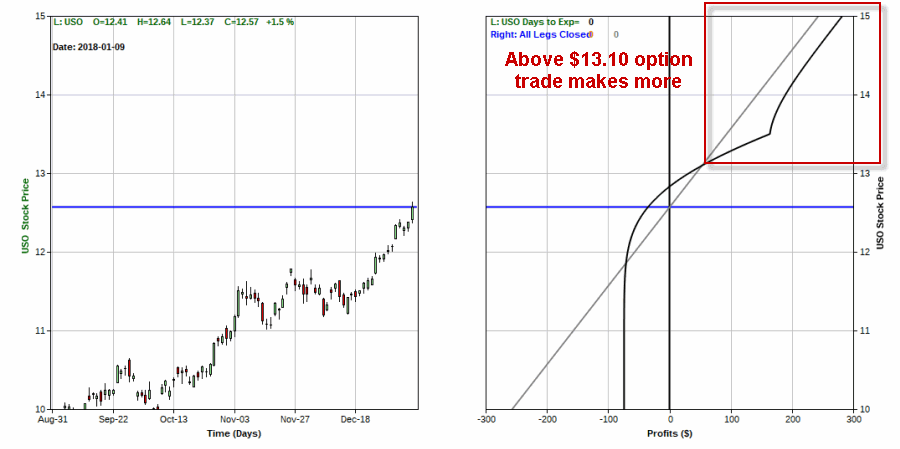
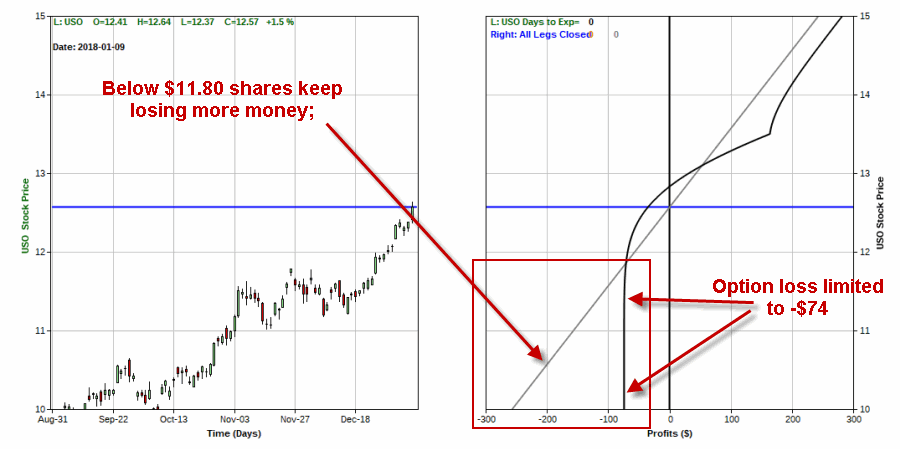
To really get the picture let’s compare the risk curves or the two trades as shown in Figures 6a, 6b and 6c. The dark black line (the one that curves) is the option trade at the time of February option expiration (Feb 16). The lighter line (the one that is a straight line represents simply owning 100 shares of USO).
If USO shares are above $13.10: the option trade will generate a higher profit than being long 100 shares of USO. Figure 6a – Comparing risk curves for Long 100 shares of USO versus Vertical Calendar Spread (Courtesy www.OptionsAnalysis.com)
If USO shares are between $11.88 and $13.10: the option trade could lose up to $30 more than simply holding 100 shares of USO (unless volatility rises sharply, which would increase the value of the option trade). Figure 6b – Comparing risk curves for Long 100 shares of USO versus Vertical Calendar Spread (Courtesy www.OptionsAnalysis.com)
If USO shares are below $11.88: The option trade worst case is a loss of -$74. The 100 shares of USO position will lose an additional $100 for each full point that USO stock declines in price.
Figure 6c – Comparing risk curves for Long 100 shares of USO versus Vertical Calendar Spread (Courtesy www.OptionsAnalysis.com)
On the Flipside
For a trader thinking USO will not follow through, the example trade in Figures 7 and 8 might make more sense. This trade involves:
*Buying 5 USO Mar 12.5 @ $0.41
*Selling 4 USO Feb 12.5 @ $0.06
 Figure 7 – Bearish USO Example trade (Courtesy www.OptionsAnalysis.com)
 Figure 8 – Risk curves for Bearish USO Example trade (Courtesy www.OptionsAnalysis.com)
Summary
For the record I am not suggesting that crude oil is going to rise from current levels. Nor am I suggesting it will fall, for that matter. The trades detailed above are simply intended to serve as examples of different, inexpensive ways to speculate at a fraction of the cost of buying or selling short the underlying shares.
Jay Kaeppel
Disclaimer: The data presented herein were obtained from various third-party sources. While I believe the data to be reliable, no representation is made as to, and no responsibility, warranty or liability is accepted for the accuracy or completeness of such information. The information, opinions and ideas expressed herein are for informational and educational purposes only and do not constitute and should not be construed as investment advice, an advertisement or offering of investment advisory services, or an offer to sell or a solicitation to buy any security.


Bloomberg has a position open for an economist/commentator – you should apply! Keep up the great work!