The U.S. Dollar attempted to rally recently following a pretty relentless January into September decline. Is that rally over? And if so is there a play to be made?
Before proceeding further, there are two important things to note:
*I am very bad at making predictions (OK, technically I am very good “making” predictions, I’m just not that good at “being right” when I do).
*This blog DOES NOT offer investment advice. I just tell you what I know (or more accurately – what I think I know) or what I see and sometimes offer examples of ways to trade said items.
Are we clear? OK, then let’s proceed. Figure 1 displays ticker UUP – an ETF that tracks the U.S. Dollar Index. Figure 1 – Ticker UUP (Courtesy ProfitSource by HUBB)
You can see the long decline in 2017, the recent rally, and now an Elliott Wave “Wave 4 Sell” as generated by ProfitSource by HUBB. Does this guarantee that the next down leg in the dollar has begun? Not at all. First off, Elliott Wave counts can be a bit nebulous at times. Also, not every “Elliottician” will agree with the count as it appears in Figure 1 (in fact, trying to get to Elliott counters to agree on a given count is sort of like trying to get Republicans and Democrats to agree on – well, anything). The reason I like using ProfitSource for this purpose is that – for better or worse – it has an objective built in algorithm for generating Elliott Wave counts. Bottom line – it is far less subjective than anything I would come up with on my own.
Figure 2 displays the current Elliott Wave counts for four currency ETFs – FXA (Australia), FXB (British Pound), FXC (Canadian Dollar) and FXE (Euro). As currencies (mostly) trade inversely to the U.S. Dollar it is interesting to note that all four of these recently generated “Wave 4 Buy” signals. Figure 2 – Tickers FXA, FXB, FXC, FXE (Courtesy ProfitSource by HUBB)
As FXE is the most heavily traded – both in terms of shares and options – let’s take a closer look as shown in Figure 3. Figure 3 – Ticker FXE (Courtesy ProfitSource by HUBB)
As you can see – again, for better or worse – the ProfitSource wave count is projecting a move to the 118.78 to 124.40 range for ticker FXE between now and March 2018. IMPORTANT NOTE: I find these kinds of projections to be very enticing. But remember, they are in fact nothing more than projections and NOT guarantees. Bottom line: acting on an Elliott Wave projection requires something of a leap of faith and involves the assumption of speculative risk.
Example Trade
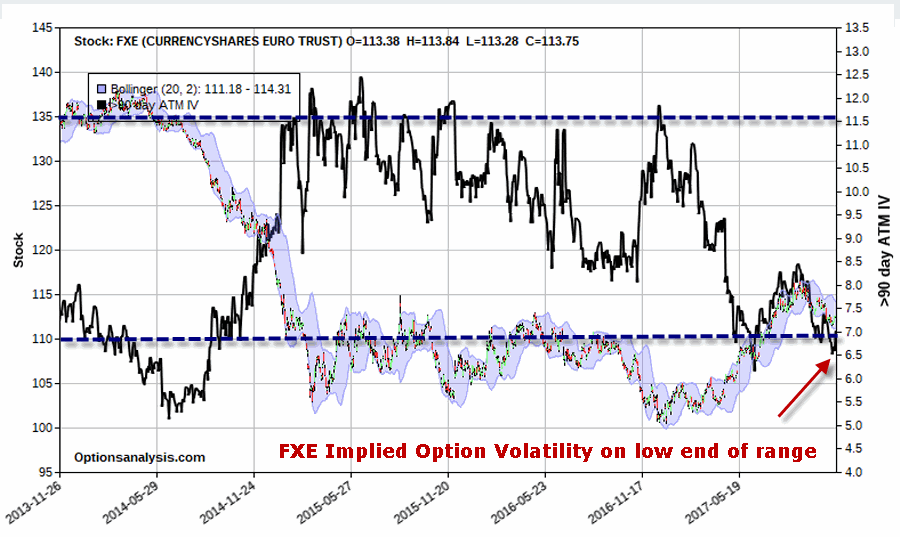
Once again, what follows is NOT a recommendation, only an example. Let’s assume one wants to speculate on a rise in ticker FXE. In Figure 4 we see that the implied volatility for options on FXE is towards the low end of the historical range. Figure 4 – Ticker FXE with 90-day implied option volatility (Courtesy www.OptionsAnalysis.com)
This tells us two things:
*The amount of time premium currently built into FXE option prices is low
*One might be able to profit from an increase in IV
The example trade is called a “Call Backspread” and involves:
*Buying 2 Mar2018 FXE 115 calls @ 1.47
*Selling 1 Mar2018 FXE 113 calls @ 2.46
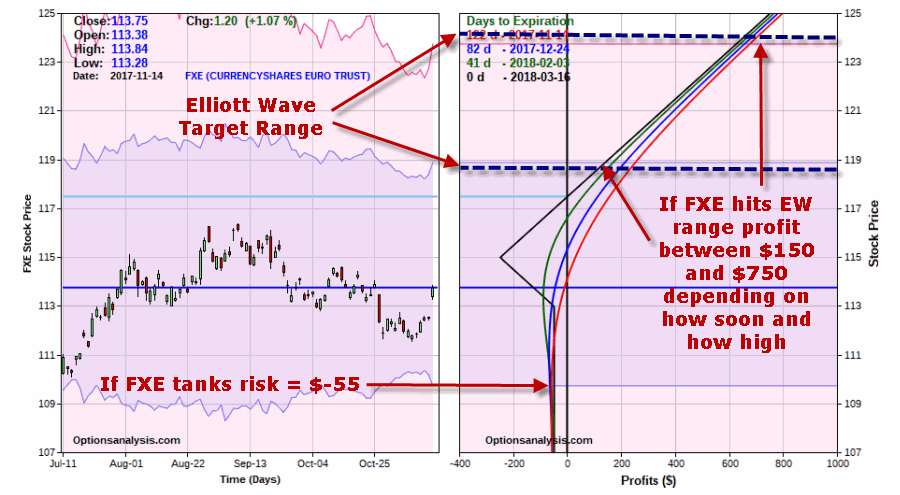
 Figure 5 – FXE backspread (Courtesy www.OptionsAnalysis.com)
 Figure 6 –FXE backspread risk curves (Courtesy www.OptionsAnalysis.com)
As you can see in Figures 5 and 6:
*The cost to enter this trade – and the maximum risk – is $248. However, a loss of -$248 would only occur if the trade is held until March expiration and FXE close that day at exactly $115 a share (i.e., we can eliminate the risk of a maximum loss simply by planning to exit the position prior to expiration).
*If FXE falls apart and collapses in price then the risk is only about -$55.
*If FXE rallies into the Elliott Wave projection range of 118.78 to 124.40 then the anticipated profit would be somewhere between +$150 and +$750, depending on how soon the move occurs and how high the price goes (sooner and higher are better).
One last item: if by chance implied volatility increases, this could inflate the profit potential for this trade.
Summary
Is the U.S. Dollar going to decline – and/or FXE going to rise? I can’t predict that. But for what it is worth the current Elliott Wave projections are pointing in that direction. The example trade discussed here is just one of many potential ways to play such a move.
Jay Kaeppel
Disclaimer: The data presented herein were obtained from various third-party sources. While I believe the data to be reliable, no representation is made as to, and no responsibility, warranty or liability is accepted for the accuracy or completeness of such information. The information, opinions and ideas expressed herein are for informational and educational purposes only and do not constitute and should not be construed as investment advice, an advertisement or offering of investment advisory services, or an offer to sell or a solicitation to buy any security.


I recently looked into one of your dollar rotation studies. Normally dx would be rallying in nov( so it’s out of phase with seasonal)
Whereas December is traditionally a bearish month so I suppose all these Elliot counts, could be setting up for that.
Ben, Yeah, for the record this particular idea did not involve any analysis of seasonality at all. It is strictly an “Elliott Wave” idea (for better or worse). Jay