In this previous article I wrote about some conflicting outlooks for crude oil in the near-term. On one hand, the software that I use is pointing to higher prices based on a bullish Elliott Wave count. On the other hand, there appears to be a lot of upside resistance and we are in a typically unfavorable seasonal period for crude oil.
For this piece we will assume that a trader:
1) Has settled on the “bearish case” and wants to enter a position that will profit if crude oil does decline in price in the days and weeks ahead.
2) Does not want to “bet the ranch”
3) Has no opinion as to how far crude oil may fall (i.e., would like to profit even if crude declines only a small amount).
The “purest” play for this trader would be to sell short crude oil futures. If crude declines the trader makes money and vice versa. The problem for a lot of traders is that each $1 movement in the price of crude oil equates to a $1,000 gain or loss in their account. Too rich for the “average” trader’s blood. So let’s consider a “cheap” alternative.
In-the-Money Put Option on Ticker USO
Ticker USO is an ETF that is designed to track the price of crude oil futures (one warning: because of the vagaries of futures pricing there can over time be significant variances between the overall movement of crude oil futures and that of ticker USO). As I write, ticker USO is trading at $10.48 a share. This means that the 13 strike price put is $2.52 “in-the-money”. The Dec 15 put is trading at $2.53 per option (or $253 since each option is for 100 shares).
For the record, a trader could easily buy a less expensive at-the-money put option. However, the reason we are opting for the ITM put in this example is because we want point-for-point movement with the underlying shares. Consider:
Strike Price – option price = breakeven price
13 – 2.53 = $10.47
USO shares are trading at $10.48; buying this put at $2.53 gives us a breakeven price of $10.47. In other words we are paying just $0.01 (x100) in time premium. Below $10.47 a share we will enjoy point for point movement just as if we had sold short shares of USO.
Figure 1 displays the particulars; Figure 2 displays the risk curves.
 Figure 1 – USO Dec 13 put (Courtesy www.OptionsAnalysis.com)
 Figure 2 – USO Dec 13 put risk curves (Courtesy www.OptionsAnalysis.com)
Position Management
Important: As always, any trade examples appearing on JayOnTheMarkets.com are for educational purposes only and should not be considered “recommendations.” With that in mind, let’s complete this example by discussing how a trader might manage this position once entered into.
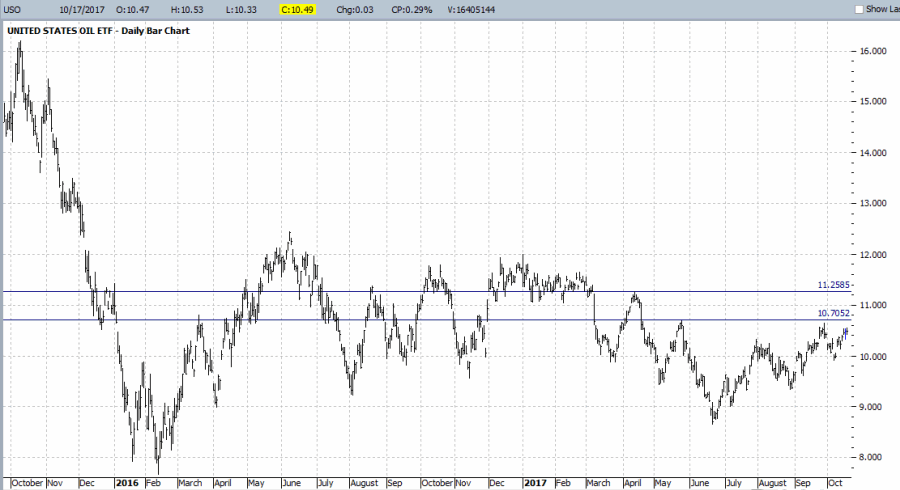
As you can see in Figure 3, there are several prices levels that could be considered as “resistance” levels. A trader holding the Dec 13 put might consider using these as “stop-loss” levels – i.e., exiting the trade, presumably with a loss, if USO rises above the chosen resistance level.  Figure 3 – USO with resistance levels (Courtesy ProfitSource by HUBB)
*If the trader exits the trade if USO rises above the first resistance level of $10.71 a share, he or she would lose roughly -$30 (out of the initial $253 investment).
*If the trader exits the trade if USO rises above the second resistance level, he or she would lose roughly -$82 (out of the initial $253 investment).
There really is no “best” choice. The key determinant is the traders own decision whether to give the trade “more room to move” or to “keep it on a tight leash.”
 Figure 4 – USO Dec 13 put position management plan (Courtesy www.OptionsAnalysis.com)
Summary
The purpose of this piece is NOT to convince you to play the short side of crude oil. The purpose of this piece is to highlight a way to get point-for-point movement via the use of options instead of trading the underlying security. Instead of selling short shares of USO – with the attendant margin requirements and unlimited risk – a trader can buy an in-the-money put for a fraction of the cost and still profit even on a small decline in the price of USO.
That’s a lot to accomplish for $253.
Jay Kaeppel
Disclaimer: The data presented herein were obtained from various third-party sources. While I believe the data to be reliable, no representation is made as to, and no responsibility, warranty or liability is accepted for the accuracy or completeness of such information. The information, opinions and ideas expressed herein are for informational and educational purposes only and do not constitute and should not be construed as investment advice, an advertisement or offering of investment advisory services, or an offer to sell or a solicitation to buy any security.

