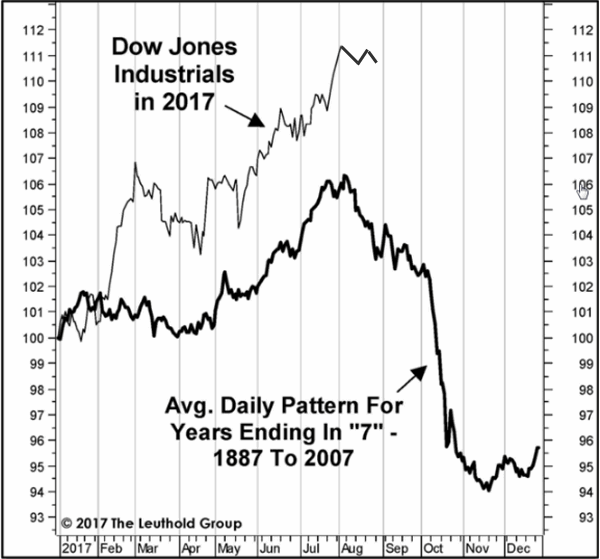
Just a short one. Under the category of “a picture is worth a thousand words” please refer to Figure 1 below. This chart is courtesy of The Leuthold Group and pretty much speaks for itself. Figure 1 – Years “7” (Courtesy: The Leuthold Group)
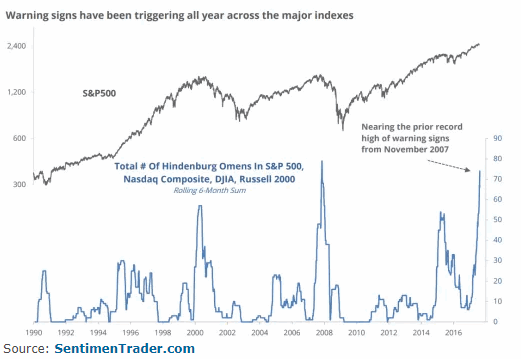
Let’s add one more “scary” picture to the mix courtesy of SentimentTrader.com. It regards something known as the “Hindenburg Omen”, defined by Investopedia.com as follows:
“A technical indicator named after the famous crash of the German airship of the late 1930s. The Hindenburg omen was developed to predict the potential for a financial market crash. It is created by monitoring the number of securities that form new 52-week highs relative to the number of securities that form new 52-week lows – the number of securities must be abnormally large. This criteria is deemed to be met when both numbers are greater than 2.2% of the total number of issues that trade on the NYSE (for that specific day). Traders use an abnormally high number of 52-week highs/lows because it suggests that market participants are starting to become unsure of the market’s future direction and therefore could be due for a major correction. Proponents of this indicator argue that it has been very accurate in predicting sharp sell-offs in the past and that there are few indicators that can predict a market crash as accurately.”
Figure 2 – A large number of occurrences of the “Hindenburg Omen” flash a potential warning sign (Courtesy: SentimentTrader.com)
Now that the scary pictures are firmly pressed in the back of your head it is also important to remember that no matter how scary/dire/grim the implication of Figures 1 and 2 is, the truth is that it does not in any way shape or form ensure that a huge stock market decline is imminent. It simply “alerts us to be alert”.
Remember the difference between a tornado watch and a tornado warning. A tornado watch simply means that the “conditions are right” for a tornado to occur. An actual tornado warning means that there is an actual tornado in progress.
So right now we are in “Stock Market Tornado Watch” mode.
To put it another way, now is the time to think about how you will “find shelter” for your investment portfolio if an actual stock market tornado appears.
One Hedge Example
The trade detailed below is not intended as a recommendation. It is simply one example of one of many ways to hedge using options. The trade involves options on ticker SH which is the Profunds Inverse S&P 500 ETF. If the S&P 500 Index goes down 2% today then ticker SH should rise roughly 2%.
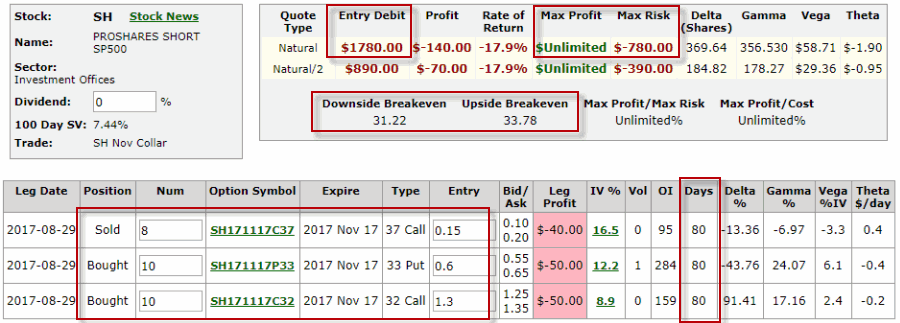
The trade involves:
*Buying 10 Nov32 calls
*Selling 8 Nov 37 calls
*Buying 10 Nov 33 puts
In technical terms it can be thought of as a “collar with an in-the-money call instead of ETF shares”. In other words we buy the Nov 32 call instead of buying shares of SH itself.
 Figure 2 – Ticker SH option hedge (Courtesy www.OptionsAnalysis.com)
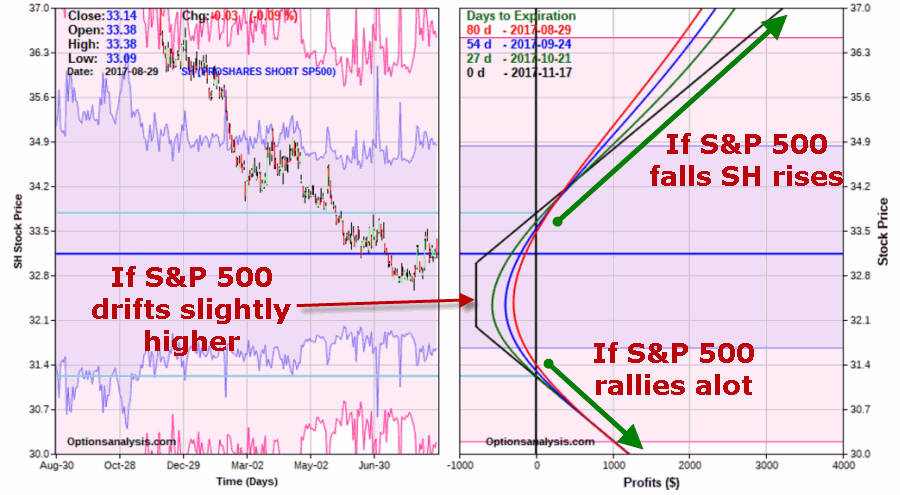
 Figure 3 – Ticker SH option hedge risk curves (Courtesy www.OptionsAnalysis.com)
For the record:
*This trade cost $1,780 to enter however the maximum risk of loss is -$780
*Maximum profit is unlimited if SH rises significantly in price (i.e. if the S&P 500 Index declines significantly in price
*Downside risk is limited and – at least in theory – if the stock market exploded to the upside and SH plunged significantly there is unlimited profit potential on the downside.
Again, not a “recommendation”, just an example.
Summary
Almost nothing about 2017 has been “typical”. So it should not surprise anyone if the “inevitable Year 7 sell off” fails to materialize. Still, being prepared in advance to weather a storm is a huge part of long-term investment success.
Jay Kaeppel
Disclaimer: The data presented herein were obtained from various third-party sources. While I believe the data to be reliable, no representation is made as to, and no responsibility, warranty or liability is accepted for the accuracy or completeness of such information. The information, opinions and ideas expressed herein are for informational and educational purposes only and do not constitute and should not be construed as investment advice, an advertisement or offering of investment advisory services, or an offer to sell or a solicitation to buy any security.


I’m a regular reader of all the ideas you present on this site and I’ve used a number of them with pretty good success before (taking on-board all your caveats about seasonality only being an indicator and not a guarantee). Your use of options resonates with me also.
I’m less sure about this idea though, mainly because of the underlying (the SH inverse S&P500 ETF). I was under the impression that these instruments have design flaws with the re-balancing method used which mean they don’t properly track the underlying (i.e. SPX in this case) so the inverse relationship doesn’t do what you expect it to.
I’m wondering if a long strangle on SPY (or the index itself) would be a similar trade that didn’t involve the inverse ETF? The bid/offer spread for options on SH doesn’t look as favourable as those for SPY, which would be another factor. Feel free to correct my misunderstanding, however, I’d genuinely be interested to hear your views on my suggested alternative.
Ralph, sorry it looks like I missed this one. Yes, a long straddle on SPY can be a reasonable alternative. In this example, the maximum risk was less for the trade in the article, which can often be the case. That being said it goes on a case by case basis and your comments regarding tracking and SH bid/ask spreads are definitely valid concerns. Jay