OK, I understand that the grain markets are not exactly everyone’s “cup of tea.” Still, as someone much smarter than me once said, “Opportunity is where you find it” (in fact, I’m so stupid I don’t even remember who said it).
So you might want to at least be aware that this is the time of year when soybeans typically start performing well. Um, but not always. Also, for the record, I am a few days late with this one but so far beans haven’t really gone anywhere so no harm. No foul.
(See also The Long and Short of Strangling Small Caps)
Seasonal Beans
Figure 1 displays the annual seasonal trend for soybean futures. Figure 1 – Soybeans Annual Seasonal Trend
One “typically” favorable period extends from the close on February Trading Day of the Month (TDM) #8 (which was February 10th of 2016) through the close of May TDM #1.
Figure 2 displays the annual gain/loss from holding a long position is soybean futures during this period each year starting in 1978. Figure 2 – Annual gain/loss from holding long 1 soybean futures contract from Feb TDM 8 through May TDM 1 (1978-2016)
Figure 3 displays the cumulative gain/loss. Figure 3 – Cumulative growth of equity from holding long 1 soybean futures contract from Feb TDM 8 through May TDM 1 (1978-2016)
For the record:
*# years showing a gain = 29 (74%)
*# years showing a loss = 10 (26%)
*Average gain =+$3,523
*Average loss = -$1,597
Please note that there is a difference between 74% accurate and “You Can’t Lose Trading Beans!”
The majority of investors will never even consider trading soybean futures (which truth be told is probably a good thing). But there are alternatives. The ETF ticker symbol SOYB is designed to track soybean futures but trade like shares of stock.
Figure 4 displays the year-by-year percentage gain or loss achieved by holding ticker SOYB form the end of Feb TDM 8 through May TDM 1 since SOYB started trading (in November of 2011).
| Year | SOYB % +(-) |
| 2012 | 12.3 |
| 2013 | (3.2) |
| 2014 | 10.1 |
| 2015 | (2.3) |
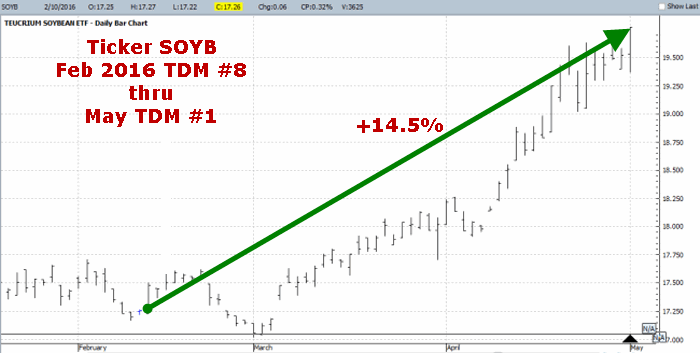
| 2016 | 14.5 |
Figure 4 – % +(-) for ETF ticker SOYB between Feb TDM 8 and May TDM 1 (2012-2016)
Figure 5 displays a chart of ticker SOYB during the Feb to May period in 2016 (Just remember it does always go this well). Figure 5 – ETF ticker SOYB in 2016
(See also This May Be a Good Time to Get Crude)
Summary
As always, this blog DOES NOT offer investment advice, only ideas. So to be clear, I have no idea if soybeans will perform well during the Feb to May period this time around and I am not recommending that you buy soybeans futures contract or shares of ticker SOYB.
That being said, at least now you may be aware of a potential opportunity that you probably were not aware of before.
Jay Kaeppel
Disclaimer: The data presented herein were obtained from various third-party sources. While I believe the data to be reliable, no representation is made as to, and no responsibility, warranty or liability is accepted for the accuracy or completeness of such information. The information, opinions and ideas expressed herein are for informational and educational purposes only and do not constitute and should not be construed as investment advice, an advertisement or offering of investment advisory services, or an offer to sell or a solicitation to buy any security.

