OK, I know what you’re thinking – “this guy is seriously behind (and a little redundant)” Well, be all that as it may, I still want to talk about the holidays. But I am not talking about any holiday in particular but rather ALL holidays and the trading days just before and after each.
(See also The Sordid Past of Years Ending in ‘7’)
Holidays and the Stock Market
The stock market has demonstrated a tendency to perform well around U.S. market holidays. Certain trading days around certain holidays have shown a tendency to perform better or worse than certain other trading days around certain holidays (example, for decades the Friday after Thanksgiving almost always showed gain). But rather than try to cut things too fine, we are going to look at one simple approach – what would the results look like if we bought and held the Dow Jones Industrials Average only during the 3 trading days before and the 3 trading days after each stock market holiday? These include:
*Martin Luther King Day
*Presidents Day
*Easter
*Memorial Day
*Independence Day
*Labor Day
*Thanksgiving
*Christmas
*New Years
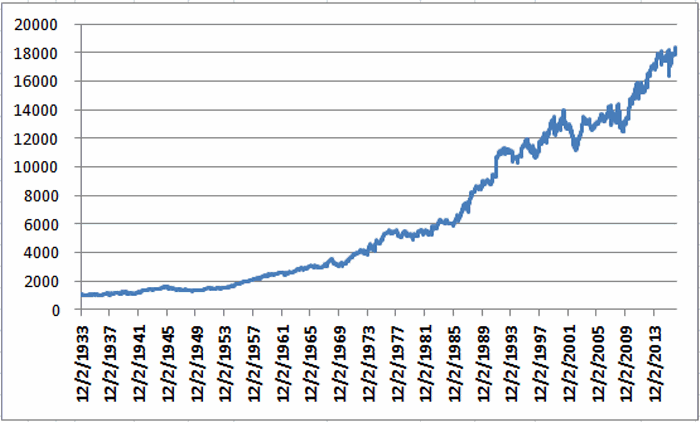
For our test we are going back to December 1933. The growth of $1,000 invested in the Dow only during the 6 trading days surrounding each stock market holiday (note that until the early 1950’s there were two holidays in February – Lincoln’s Birthday and Washington’s Birthday – which were ultimately combined into President’s Day. Also, Martin Luther King Day was first celebrated in 1998) appears in Figure 1.
In order to capture only the market action around holidays, no interest is assumed to be earned during all other days. Figure 1 – Growth of $1,000 invested in Dow Jones Industrials Average only during the 3 trading days before and 3 trading days after each stock market holiday (1933-2017)
As you can see in Figure 1 the long-term trend has been:
*Persistently favorable, but
*Not without bumps in the road
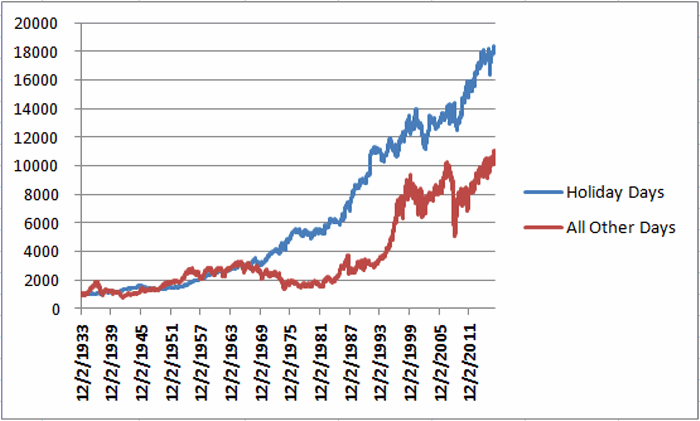
These “Holiday Days” comprise roughly 23.3% of all trading days. What makes the results fairly interesting is when we compare these “Holiday Days” to “all other trading days.”
Figure 2 displays the same line as in Figure 1 (blue line). It also plots the growth of $1,000 invested in the Dow only during “all other trading days” (red line). Figure 2 – Growth of $1,000 invested during “Holiday Days” (blue line) versus “All Other Days” (red line); 1933-present
For the record:
| Measure | Holiday Days | All Other Days |
| % of All Trading Days | 23.3% | 72.7% |
| $1,000 becomes | $18,121 | $11,029 |
| Cumulative % +(-) | +1,712.1% | +1,002.9% |
| % Up Days | 54.7% | 51.8% |
| %Down/Unch Days | 45.3% | 48.2% |
| Ave. daily %+(-) | +0.0752% | +0.0135% |
| Median daily%+(-) | +0.0787% | +0.0408% |
Figure 3 – Facts and Figures for “Holiday Days” versus “All Other Days”
(See also With Retailers, it’s ‘When’ Not ‘What’)
Summary
Despite the fact that “Holiday Days” comprised only 23% of all trading days since 1933, they actually generated a greater cumulative return than the “other” 77% of all trading days. Likewise, they realized a higher percentage of up days and a much higher average and median daily rate of return.
So the summary in this case is simple:
We need to contact our representatives and demand more holidays!
Jay Kaeppel


Which ticker symbol are you referring to: INDU or DOW? Is this only a total of 12 days in the Trade? Thanks in advance.
Mamie, ticker INDU, i.e, the Dow Jones Industrials Average. Also, most of the trades (except for Christmas and New Year’s overlap) are 6 trading days long – 3 days before and 3 days after the holiday. Jay
Thanks for your time and patience.
In OA I found the ticker symbol to be DJX. It doesn’t recognize INDU.