If you are looking for a market sector with some serious seasonal trends, look no further than the energy sector. In this article, I noted the bullish tendency for ticker FSESX during the months of February, March and April. In this piece, we will add one more “favorable” month and then also look at a 6-month “unfavorable” period.
For the record, the information that follows is not being recommended as a standalone strategy. It is presented simply to make you aware of certain long-term trends that have been very persistently bullish (or bearish as the case may be) in the energy sector.
(See also Why You Should Be Rooting for a Bullish January)
4 Favorable Months
*The four “favorable” months for our test are February, March, April and December
Figure 1 displays the growth of $1,000 invested in ticker FSESX only during these four months every year since 1986 versus simply buying-and-holding ticker FSESX. Figure 1 – Growth of $1,000 invested in FSESX only during Feb, Mar, Apr, Dec every year since 1986
Starting in 1986, an initial $1,000 investment grew to $76,019 (or +7,500%) versus $10,237 (or 923%) using a buy-and-hold strategy.
6 Unfavorable Months
The six “Unfavorable” months are June, July, August, September, October and November.
First the “positive” news:
*This 6-month period has managed to show a gain 14 times in 31 years – so by no means should you consider this period a “sure thing” loser
*During 4 separate years – 1997, 2003, 2004 and 2010 – the “unfavorable” months registered a cumulative gain in excess of +30%.
Doesn’t sound all that “unfavorable” so far does it? But here’s the catch: Despite the occasional 30%or more gain, it is fair to refer to this 6-month period as “unfavorable” as the cumulative long-term results of buying and holding FSESX during these months has been nothing short of devastating.
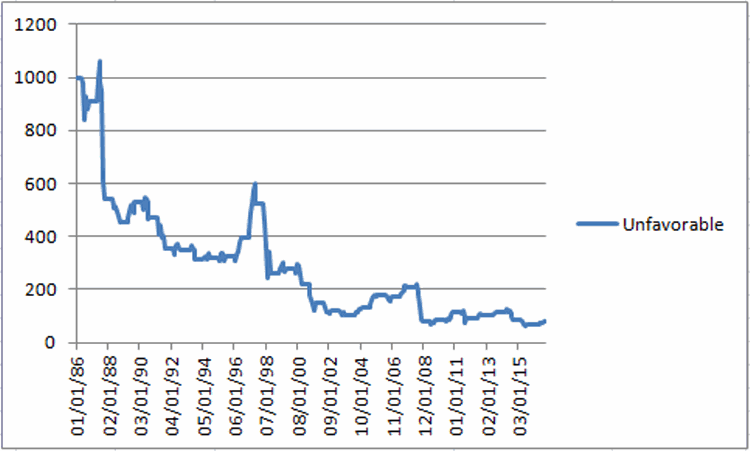
Figure 2 displays the growth of $1,000 invested in ticker FSESX only between the end of May and the end of November every year starting in 1986. Figure 2 – Growth of $1,000 invested in FSESX only during June through November every year since 1986
Starting in 1986, an initial $1,000 investment declined to just $82, or a cumulative loss of -91.8%
Figure 3 displays some comparative data between favorable and unfavorable periods as well as using a Buy-and-Hold strategy.
| Measure | Buy-and-Hold | 4 Favorable Months | 6 Unfavorable Months |
| Average Annual % +(-) | 12.8 | 16.5 | (-4.2) |
| Median Annual % +(-) | 8.7 | 15.5 | (-1.8) |
| Standard Deviation | 33.4 | 20.1 | 24.6 |
| # Years UP | 18 | 26 | 14 |
| # Years DOWN | 13 | 5 | 17 |
| Worst Year | (-55.4) 2008 | (-7.6) 1994 | (-62.8) 2008 |
| $1,000 becomes | $10,237 | $76,019 | $82 |
| Cumulative % +(-) | +923% | +7,500% | (-92%) |
Figure 3 – Comparative Results
Figure 4 displays the year-to-year results for a Buy-and-Hold approach versus holding only during the 4 “favorable” months or the “Unfavorable” 6 months.
| Year | All 12 months % +(-) | 4 Favorable % +(-) | 6 Unfavorable % +(-) |
| 1986 | (8.9) | (5.2) | (9.2) |
| 1987 | (20.7) | 22.9 | (40.1) |
| 1988 | (4.2) | 22.8 | (16.3) |
| 1989 | 50.3 | 27.1 | 16.2 |
| 1990 | 8.7 | 4.9 | (11.2) |
| 1991 | (19.9) | 4.1 | (25.0) |
| 1992 | 4.9 | (1.6) | (1.3) |
| 1993 | 16.4 | 24.5 | (10.7) |
| 1994 | (0.5) | (7.6) | 3.1 |
| 1995 | 40.0 | 33.7 | 2.0 |
| 1996 | 45.9 | 22.5 | 20.8 |
| 1997 | 43.9 | (4.9) | 32.9 |
| 1998 | (41.4) | 26.5 | (50.5) |
| 1999 | 80.9 | 74.1 | 7.5 |
| 2000 | 51.7 | 77.6 | (21.1) |
| 2001 | (22.4) | 20.8 | (32.4) |
| 2002 | 2.2 | 26.2 | (18.0) |
| 2003 | 13.1 | 15.5 | (16.0) |
| 2004 | 26.2 | 1.2 | 30.2 |
| 2005 | 47.4 | 4.8 | 34.0 |
| 2006 | (9.1) | (4.1) | (1.8) |
| 2007 | 58.3 | 25.6 | 16.7 |
| 2008 | (55.4) | 10.5 | (62.8) |
| 2009 | 60.4 | 24.5 | 9.6 |
| 2010 | 31.7 | 21.6 | 33.7 |
| 2011 | (18.5) | 3.1 | (16.8) |
| 2012 | (3.9) | 0.7 | 9.6 |
| 2013 | 14.1 | 0.3 | 11.5 |
| 2014 | (19.5) | 7.2 | (26.7) |
| 2015 | (19.7) | 2.9 | (17.9) |
| 2016 | 44.2 | 28.4 | 20.1 |
Figure 4 – Yearly % +(-) for Buy-and-Hold versus 4 Favorable Months versus 6 Unfavorable Months
Summary
There is no guarantee from year-to-year results of buying and holding ticker FSESX during the “Favorable 4” months will show a gain and/or outperform the “Unfavorable 6” months. And there is by no means any guarantee that the “Unfavorable 6” will show a loss during any given year (note that 2016 saw the Unfavorable 6 generate a cumulative gain of +20.1%!). So just remember that we are talking about some very long-term trends here.
Still, most investors can discern the difference between:
*Favorable 4 months gain = +7,500%
*Unfavorable 6 months loss = (-92%)
This type of difference is what we “quantitative types” refer to as “statistically significant.”
Jay Kaeppel

