The only thing I loathe more than politics are actual politicians. So whatever side of the (somehow) “debate” (doesn’t seem nearly a strong enough word) you are on, please do not get mad at me – or applaud me – for what follows ( bottom line: I don’t care about your political leanings anymore that I expect you to care about mine).
The gist of this article has nothing really to do with politics, but more to do with market history. As a “student of market history” and as a proud graduate of “The School of Whatever Works” (Good ole’ SWW – our school cheer: “Whatever!”) I have seen enough “patterns repeat” that I for one find a number of uses for seasonal analysis. So here is one (admittedly somewhat arcane – and involving an exceptionally small sample size of 3) relatively recent historical pattern that potentially bodes ill for the stock market later this year and well into next.
(See also Potentially Foolish Speculative Ideas for 2017)
New Republican Administrations and the Stock Market
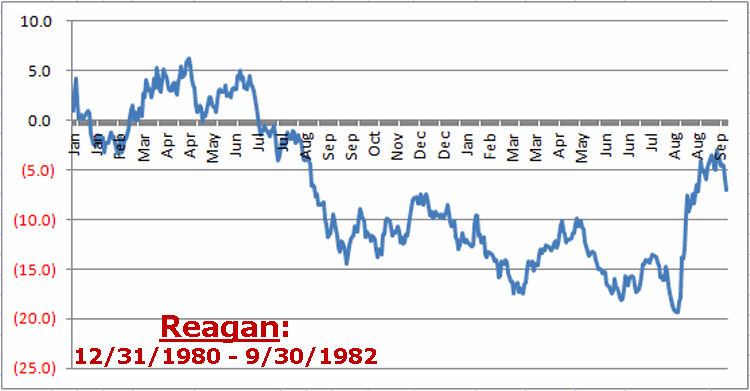
A “new” Republican Administration is defined here as one that “follows an outgoing Democratic Administration.” The last 3 were Nixon, Reagan and Bush II. Figures 1, 2 and 3 below display the % gain/loss for the Dow Jones Industrials Average from December 31st of the election year through September of the subsequent mid-term election year for each of the 3 Presidents mentioned above. Figure 1 – Dow %+(-) during 1st 21 months of Nixon administration
 Figure 2 – Dow %+(-) during 1st 21 months of Reagan administration
 Figure 3 – Dow %+(-) during 1st 21 months of Bush II administration
Anything jump out at you? So does this imply that the first 20 or so months of the Trump Administration are doomed to witness poor stock market performance? Not at all. Still, before moving on let’s take a look at the “average” Dow performance during the first 21 months of the last 3 “new” Republican administrations and project it forward, which appears in Figure 4. Figure 4 – Average performance from Figures 1, 2 and 3 above projected forward
So are stocks really going to sell off between May and September of this year and April and August of 2018? It beats me. No one should interpret Figure 4 as a “prediction”. In my mind it serves as nothing more than “something to keep in mind.”
And I do think that there is a “right way” and a “wrong way” to look at these numbers.
The “Wrong Way”: “I better avoid the stock market because it is doomed to decline in the next 21 months.”
The “Right Way”: If stocks start to decline – and say, the major indexes take out a meaningful moving average – especially if this decline starts in May or sometime after, history suggest that I might do well to take defensive action and not just attempt to “ride the storm out.”
In other words, the results depicted here are nothing to panic about. But they are worth being aware of – and being prepared for.
Jay Kaeppel


Jay,
1) Since S&P data is available on Yahoo starting in 1950, why not include Eisenhower? If you use the Dow, you could also include Harding. Even so, four or five is not a meaningful sample size as you point out.
2) To my way of thinking, which may not be yours or many others, there was a secular bear market from 1966-82 and the current one started in 2000 and is still in place. All three of the cases you show took place during a secular bear regardless of whether the one that started in 2000 ended in 2009 as some have claimed. If we think we are still in a secular bear market, then Trump fits the pattern. If you add Eisenhower, that would be different since we were in a secular bull market then.
Mark, Excellent points! It does require a leap of faith to think that what happened in 1969 has anything at all to do with what will happen this year. But the purpose of this blog is to put the information out there and readers can do with it what they may. For the record, Eisenhower’s first year fit the same pattern – down signicantly during mid to late year (although it rallied sharply from there), Jay