Monthly Archives: January 2017

It’s Hard With ‘Oil’ These Choices

On 1/5/17 I wrote about a bearish position on ticker USO – an ETF that purportedly tracks the price of crude oil.  This article updates the status of that position and considers several potential actions from here.

(See also Why You Should Be Rooting for a Bullish January)

The Great Irony of Option Trading

The “Great Irony of Option Trading” is that the best thing about option trading is also the worst thing about option trading, as captured quite succinctly in:

Jay’s Trading Maxim #74a: The best thing about option trading is that there are so many choices.

Jay’s Trading Maxim #74b: The worst thing about option trading is that there are sooooooooooooo………………. many choices!

Unlike many stock and mutual fund strategies, option trading strategies are rarely of the “set it and forget it” variety.   Also, a given position can evolve and be adjusted into an entirely different – and potentially more favorable – position.  In the 1/5/17 article I wrote about a hypothetical bearish option position for crude oil.  In this piece we will update that trade and then examine some of those $%^& choices.

(See also A Two-Fund Portfolio for the Next 3 Months)

Bearish on USO

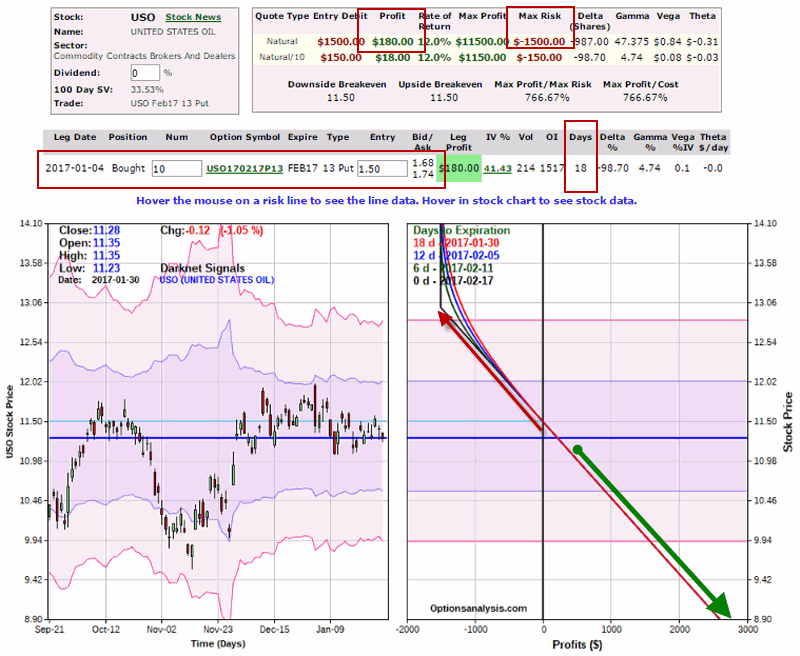
On 1/5/17 I wrote about a bearish position on ticker USO – an ETF that purportedly tracks the price of crude oil.  It involved buying the in-the-money February 13 put.  By buying in-the-money the negative effect of time decay was essentially eliminated as very little time premium was paid in the first place. Since that time USO has bounced up and down in a fairly tight range. As of the close on 1/30 the position had a small profit of $180 as displayed in Figure 1.

(click to enlarge)1Figure 1 – USO Feb 13 puts (Courtesy www.OptionsAnalysis.com)
So the question is “what to do from here.”  As always there are choices. To wit:

So Many Choices

Choice #1: A trader still thinks crude is going to break lower between now and February expiration (2/17).

In this case, no action needs to be taken.  As you can see in Figure 1, the good news is that if USO plunges this trade will make a lot of money. The bad news is that if USO rallies this trade could still turn into a $1,500 loss of premium.

Choice #2: A trader thinks USO will decline in the relatively near future but would like to cut the risk of experiencing a loss.

In this case the trader could:

*Sell 10 USO Feb 13 puts

*Buy 2 USO Mar 11.5 puts

(click to enlarge)2Figure 2 – USO Mar 11.5 puts (Courtesy www.OptionsAnalysis.com)
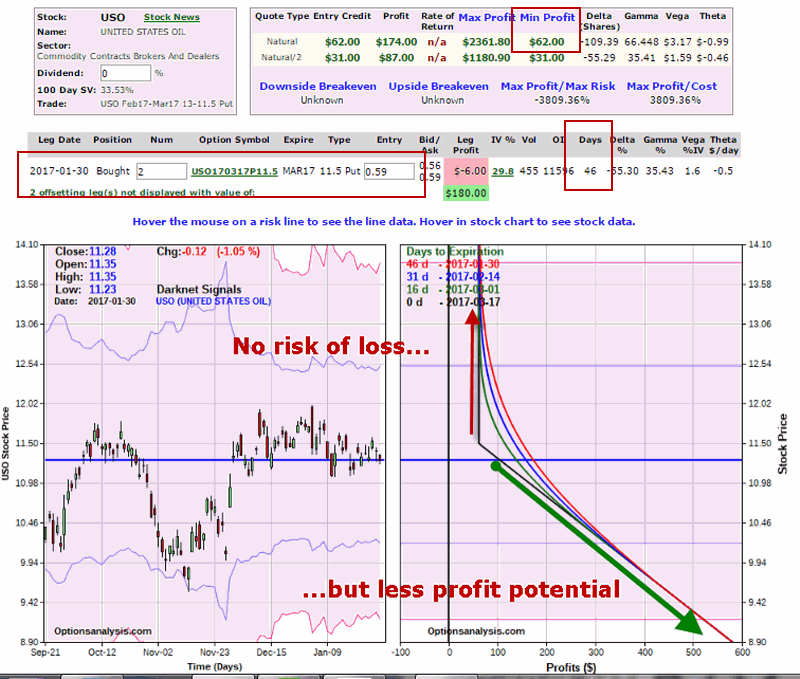
The good news is that there is now no risk of losing money on this trade.  The bad news is that the profit potential is greatly diminished if in fact USO does finally plunge in price.

Choice #3: Flip to a Bullish position.

As I have written about here and here, energy related securities and products have a tendency to rise during the late winter, early spring season. So let’s say a trader decides it’s time to cash in the existing trade and “flip to the other side”.  By making the trade below he or she can essentially “use the house money” to bet that crude oil will rally sharply in 2017.

*Sell 10 USO Feb 13 puts

*Buy 2 USO Jan18 13 calls

(click to enlarge)3Figure 3 – USO Jan18 13 calls (Courtesy www.OptionsAnalysis.com)
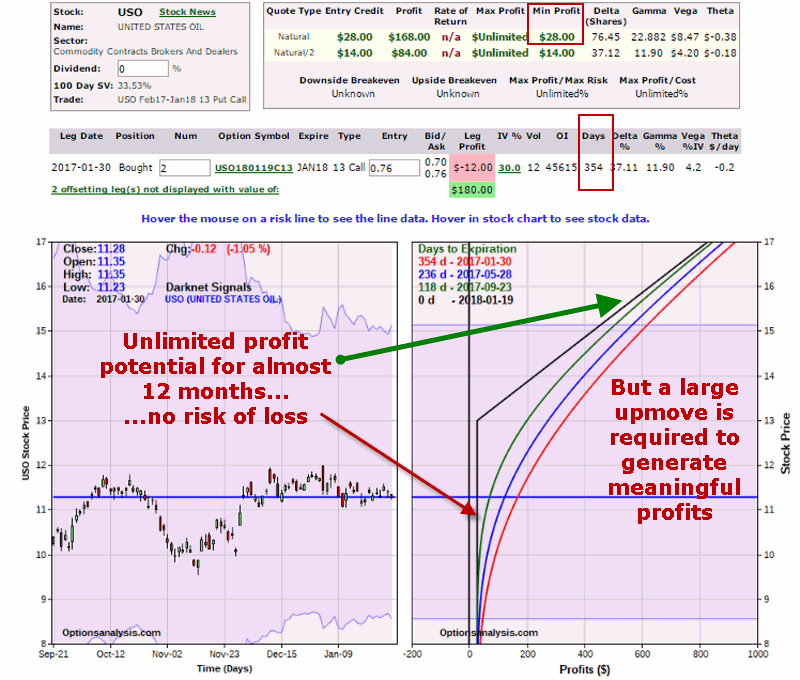
The good news is that the trader in this case now has until Janaury of 2018 for USO to make a move higher, with no risk of loss.

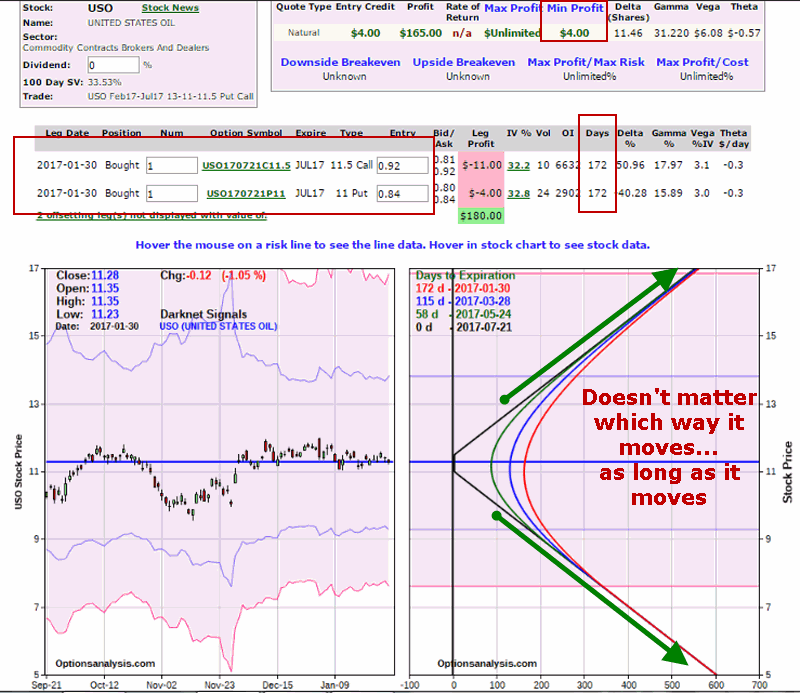
Choice #4: A trader has no idea which way USO is headed anymore but doesn’t want to risk the initial $1,500 anymore.

He or she might:

*Sell 10 USO Feb 13 puts

*Buy 1 USO Jul 11.5 call AND Buy 1 USO Jul 11 put

(click to enlarge)4Figure 4 – USO Jul 11.5 call and Jul 11 put (Courtesy www.OptionsAnalysis.com)
Summary

So which is the proper choice?  Ah, there’s the rub.  But now you have some idea regarding the “good news” and “bad news” associated with the many choices available to an option trader.

Remember, choose wisely.

Jay Kaeppel
Happy ‘Holiday Days’ in Action

The good news is that the stock market has demonstrated a persistent historical tendency to perform well around stock market holidays (as I detailed here).  The bad news is that we simply do not have enough holidays (can I get an “Amen”?) Well, at least not enough to justify a standalone holiday trading strategy.

Or do we?

(See also Why You Should Be Rooting for a Bullish January)

One Approach to Holiday Trading

For this test we will employ the following rules:

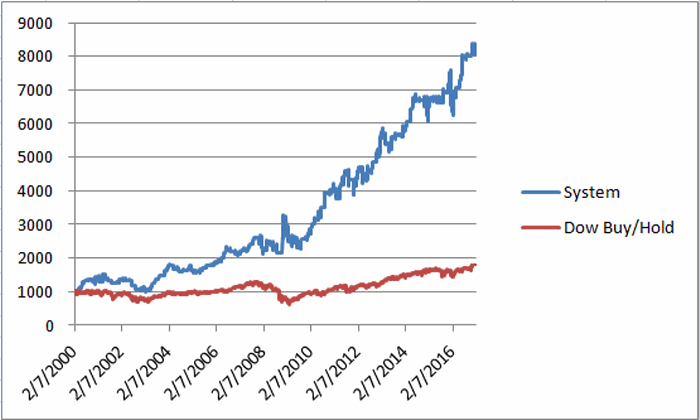
*If today is within 3 trading days before or 3 trading days after a stock market holiday we will hold ticker UMPIX (Profunds Ultra MidCap – which tracks the daily change for the S&P 400 MidCap Index times 2).

*For all other trading days we will hold cash and will assume we earn an annualized rate of interest of 1%.

*We will start our test on 2/7/2000, which was the first day of trading for ticker UMPIX

The growth of $1,000 invested using the rules above appears in Figure 1 along with the growth of $1,000 invested in the Dow Jones Industrials average on a buy-and-hold basis during the same time.1Figure 1 – Growth of $1,000 invested in ticker UMPIX using Holiday Days Trading Rules (blue line) versus buying and holding the Dow Jones Industrials Average (red line); 2/7/00-1/24/17

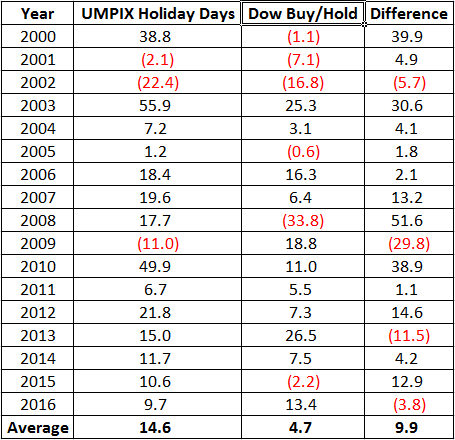
The annual returns for this method versus Dow buy-and-hold appear in Figure 2.

2

Figure 2 – Annual Results of Holiday Days Trading Method versus Dow Buy/Hold

*Figures for Year 2000 in  Figure 2 start on 2/7/2000

For the record:

*The system is in UMPIX only 20.75% of all trading days and in cash 79.25% of all trading days.

*The average annual return for System = +14.6%

*The average annual return for Dow Buy-and-Hold = +4.7%

*The maximum System drawdown was -34.3%

*The maximum Dow Buy/Hold drawdown was -53.8%

(See also Please Don’t Buy That S&P 500 Index Fund)

Summary

So is this simple approach to holiday trading a viable standalone strategy?  I will leave you to draw your own conclusions.

Jay Kaeppel

Happy ‘Holiday Days’

OK, I know what you’re thinking – “this guy is seriously behind (and a little redundant)”  Well, be all that as it may, I still want to talk about the holidays.  But I am not talking about any holiday in particular but rather ALL holidays and the trading days just before and after each.

(See also The Sordid Past of Years Ending in ‘7’)

Holidays and the Stock Market

The stock market has demonstrated a  tendency to perform well around U.S. market holidays.  Certain trading days around certain holidays have shown a tendency to perform better or worse than certain other trading days around certain holidays (example, for decades the Friday after Thanksgiving almost always showed  gain).  But rather than try to cut things too fine, we are going to look at one simple approach – what would the results look like if we bought and held the Dow Jones Industrials Average only during the 3 trading days before and the 3 trading days after each stock market holiday?  These include:

*Martin Luther King Day

*Presidents Day

*Easter

*Memorial Day

*Independence Day

*Labor Day

*Thanksgiving

*Christmas

*New Years

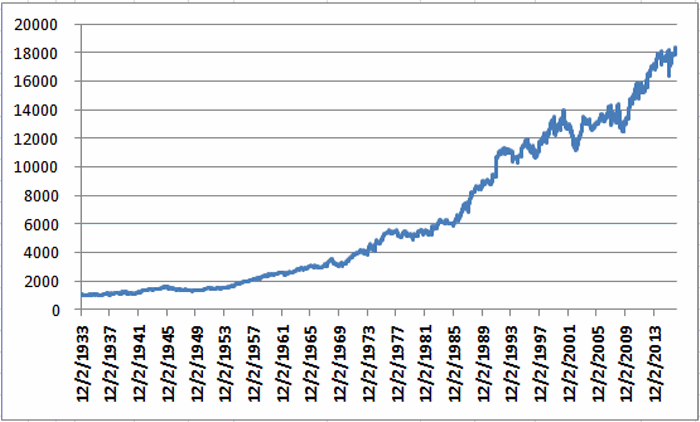
For our test we are going back to December 1933. The growth of $1,000 invested in the Dow only during the 6 trading days surrounding each stock market holiday (note that until the early 1950’s there were two holidays in February – Lincoln’s Birthday and Washington’s Birthday – which were ultimately combined into President’s Day.  Also, Martin Luther King Day was first celebrated in 1998) appears in Figure 1.

In order to capture only the market action around holidays, no interest is assumed to be earned during all other days.1Figure 1 – Growth of $1,000 invested in Dow Jones Industrials Average only during the 3 trading days before and 3 trading days after each stock market holiday (1933-2017)

As you can see in Figure 1 the long-term trend has been:

*Persistently favorable, but

*Not without bumps in the road

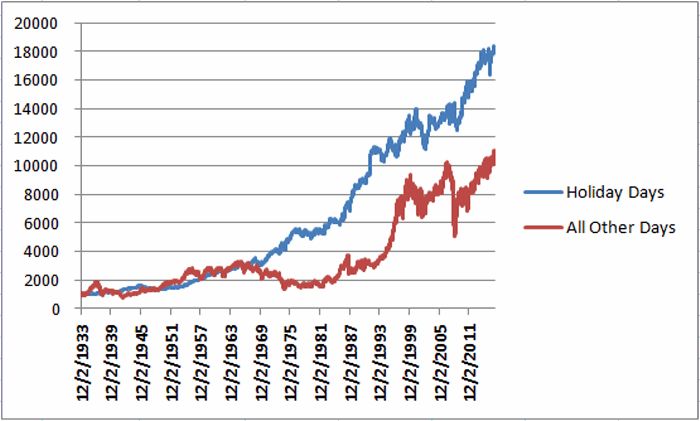
These “Holiday Days” comprise roughly 23.3% of all trading days. What makes the results fairly interesting is when we compare these “Holiday Days” to “all other trading days.”

Figure 2 displays the same line as in Figure 1 (blue line).  It also plots the growth of $1,000 invested in the Dow only during “all other trading days” (red line).2Figure 2 – Growth of $1,000 invested during “Holiday Days” (blue line) versus “All Other Days” (red line); 1933-present

For the record:

Measure Holiday Days All Other Days
% of All Trading Days 23.3% 72.7%
$1,000 becomes $18,121 $11,029
Cumulative % +(-) +1,712.1% +1,002.9%
% Up Days 54.7% 51.8%
%Down/Unch Days 45.3% 48.2%
Ave. daily %+(-) +0.0752% +0.0135%
Median daily%+(-) +0.0787% +0.0408%

Figure 3 – Facts and Figures for “Holiday Days” versus “All Other Days”

(See also With Retailers, it’s ‘When’ Not ‘What’)

Summary

Despite the fact that “Holiday Days” comprised only 23% of all trading days since 1933, they actually generated a greater cumulative return than the “other” 77% of all trading days. Likewise, they realized a higher percentage of up days and a much higher average and median daily rate of return.

So the summary in this case is simple:

We need to contact our representatives and demand more holidays!

Jay Kaeppel

With Retailers, it’s ‘When’ Not ‘What’

I’ve been seeing a number of panicked missives lately regarding the retailing sector.  They typically go something like this:

“Despite new highs for most of the major market indexes, the retailing sector has been struggling – and in some cases hit hard – therefore it is clearly (paraphrasing here) THE END OF THE WORLD AS WE KNOW IT, AHHHHHHHHHHHHH……………………..”

Or something along those lines.  And the truth is that they may be right.  But as it turns out, with the retailing sector it is typically more a question of “when” and not “what” (or even WTF for that matter).

(See also Months to Beware of in 2017)

Recent Results

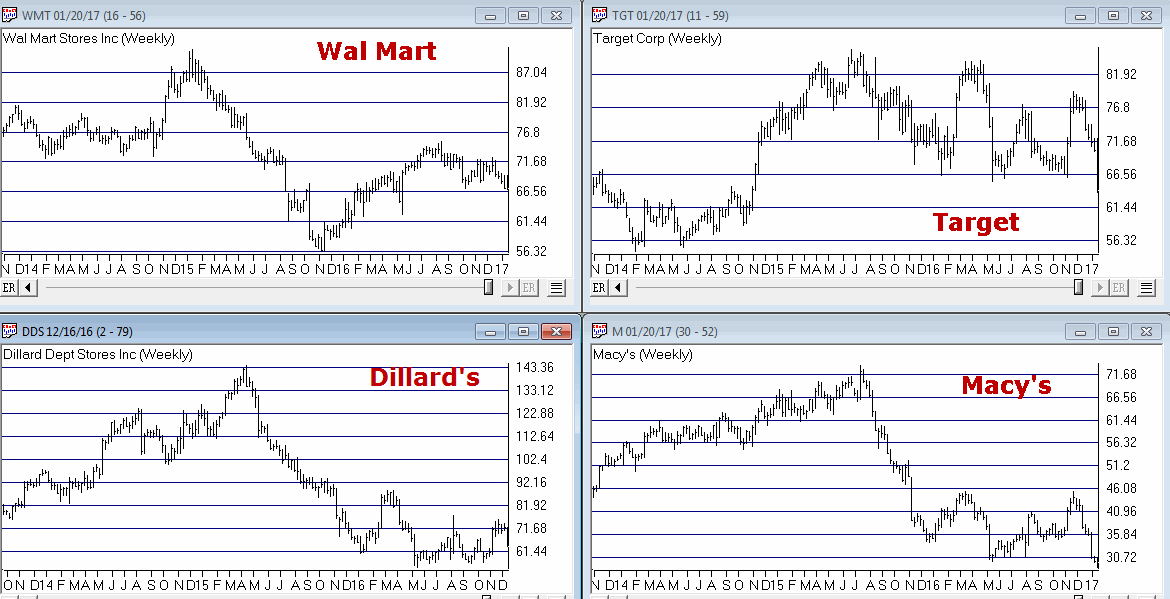
The concerns alluded to above are understandable given recent results in certain segments of the retailing sector. Figure 1 displays the stock price action for four major retailers.  It isn’t pretty.

(click to enlarge)1Figure 1 – Major retailers taking a hit (Courtesy AIQ TradingExpert)

So if major retailers are performing poorly one can certainly see why someone might extrapolate this to conclude that the economy is not firing on all cylinders and that the recent rally to new highs by the major averages is just a mirage.  And again, that opinion may ultimately prove to be correct this time around.

But before swearing off of retailing stocks, consider the following.

Retailers – When not What

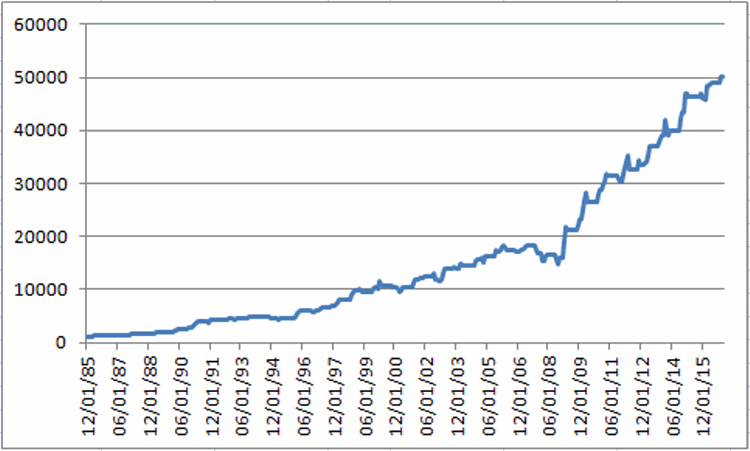
For our test we will use monthly total return data for the Fidelity Select Retailing sector fund (ticker FSRPX).  Figure 2 displays the growth of $1,000 invested in FSRPX only during the months of:

*February, March, April, May, November, December

2Figure 2 – Growth of $1,000 invested in ticker FSRPX only during the “favorable” months since 1986

For the record:

*An initial $1,000 grew to $50,274, or +4,927% (this test does not include any interest earned during the months out of FSRPX).

*# of years showing a net gain = 27

*# of years showing a net loss = 4

*Average UP year = +17.0%

*Average DOWN year = (-3.4%)

*Maximum UP Year = +50.0% (1990)

*Maximum DOWN Year = (-5.9%) (1994)

The Year-by-Year Results appear in Figure 3

Year % +(-)
1986 26.2
1987 15.8
1988 12.2
1989 16.9
1990 50.0
1991 45.5
1992 8.0
1993 4.6
1994 (5.9)
1995 3.0
1996 26.1
1997 18.1
1998 45.7
1999 4.0
2000 1.8
2001 12.5
2002 (0.1)
2003 18.5
2004 11.3
2005 10.3
2006 0.1
2007 (2.8)
2008 (4.7)
2009 44.9
2010 24.5
2011 4.6
2012 10.8
2013 16.6
2014 11.5
2015 6.1
2016 9.2

Figure 3 – Year-by-Year Results for  “Favorable” Months since 1986

The Rest of the Year

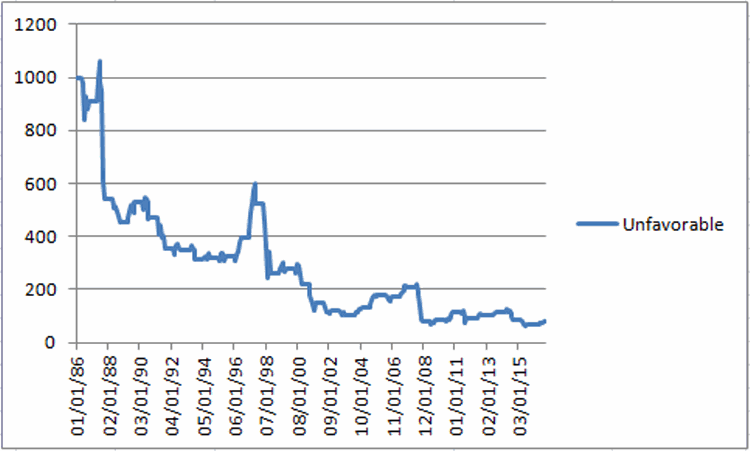
If for some reason you had decided to skip the months above and hold FSRPX only during all of the other months of the year, your results appear in Figure 4.4Figure 4 – Growth of $1,000 invested in ticker FSRPX only during the “unfavorable” months since 1986

For the record:

*An initial $1,000 grew to $1,037, or +3.7% (this test does not include any interest earned during the months out of FSRPX).

Summary

Is the retailing sector guaranteed to generate a gain during our “favorable” months in 2017?  Not at all.  Still, given that retailing is presently beaten down a bit and the fact that the worst full year loss during the favorable months was -5.9%, it may be time to think about taking a look (although – as always, and for the record – I am not “recommending” retailing stocks, only pointing out the historical trends).

Still, as the old saying goes, the results below are what we “quantitative types” refer to as “statistically significant”.

*Favorable months since 1986 = +4,927%

*Unfavorable months since 1986 = +3.7%

Jay Kaeppel

A Quick Look Back at the Biotech Bust

I don’t like to toot my own horn.  Wait, come to think of it, actually I do.  The problem is that I just don’t get the opportunity very often. The truth is that I am just not very good at “predicting” things.  Fortunately, being a trend-follower – or more often a “buyer on a dip in an uptrend”, my shortcomings as a “visionary” aren’t the end of the world.

(See also: Out With the Old, In With the, Uh-Oh)

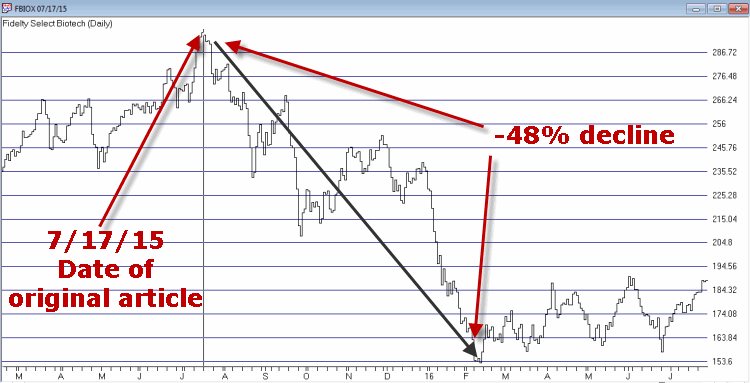
Still, if you pay close enough attention to the markets eventually you can sort of get a sense when history is repeating.  And every once in a great while – and admittedly in this case, by sheer coincidence – you get one exactly right.  In this article, dated 7/17/2015, I noted that the biotech sector appeared to be was experiencing a blow-off top – similar to, if not even more extreme than the 1998-2000 blow off top.

As you can see in Figure 1 below, the date of that article just so happened to coincide with the exact day that Fidelity Select Biotech topped out.  From there FBIOX plunged -48% in 7 months. Even today – and despite new highs by most of the major stock market average – FBIOX languishes -38% off of its July 2015 high.20a 1Figure 1 – Fidelity Select Biotech(ticker FBIOX)

So does this mean that I am capable of calling tops and bottoms with uncanny accuracy?  Har.  (Pssst, and the truth is there is no one who actually can).  What it does mean is that – at least on occasion – I may have the ability to identify a high risk area for a given security.  Turns out that’s a pretty valuable skill to develop.

Toot toot

Jay Kaeppel

The Sordid Past of Years Ending in “7”

Don’t worry, this story does not involve Russian hookers (nor Blue Dresses).  It is still a pretty sordid tale.

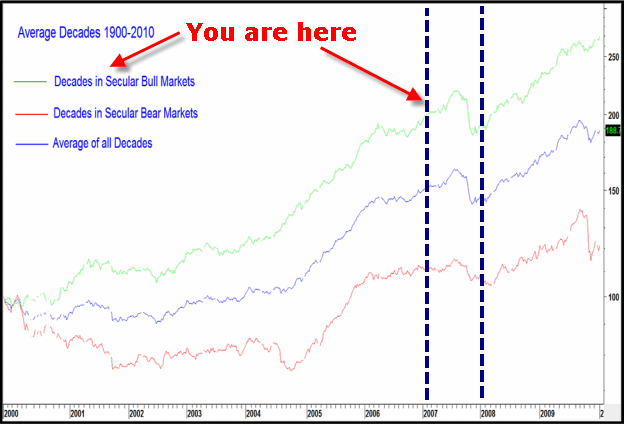
In Months to Beware of in 2017 I included certain months “within Years Ending in 7” as months to be cautious.  The “Years Ending in 7” seems pretty obscure but is founded in the “typical” pattern for the stock market across a given decade.  Figure 1 below is from something written by Martin Pring in 2009 or 2010.  But it shows a chart with the “typical Decennial Pattern” (he draws three lines, one for secular bull markets, one for secular bear markets and one for “All Decades” the blue line in the middle).  Note that Years 7 within a secular bull market tend to take a big hit in the 2nd half of the year.decennial patternFigure 1 – The Decennial Stock Market Pattern (Martin Pring)

(See also The One Asset Class Per Month Strategy)

Note the tendency for a meaningful decline during Year 7.  If you click on the link above and scroll down to Page 11 you can see the decade-by-decade results for the Dow. Here is what you’ll find:

Years that witnessed a meaningful decline:

1907

1917

1937

1957

1977

1987

2007

Year that witnessed intermediate-term tops

1947

1967

1997

Years relatively unaffected

1927

Note that 1927 is the only Year 7 that escaped relatively unscathed.  So that’s why “Years Ending in 7” was included in Months to Beware of in 2017.  Does any of this guarantee a bad year for the stock market in 2017?  Not at all.  But – referencing my earlier article – the months of February and especially September and October has witnessed alot of stock market  mayhem  during Years ending in “7”.

Here’s hoping that 2017 will  be the exception to the rule.

Jay Kaeppel

Months to Beware of in 2017

We are going to go “off the beaten” a bit (or perhaps I should say a bit more than usual) this time out and highlight an anomaly that may be either:

*Potentially very useful

*Completely Random

You make the call.

(See also A Two-Fund Portfolio for the Next 3 Months)

A Tale of Two “Types of Years” and 3 Unfavorable Months Therein

In the realm of the slightly mind-addled world of seasonal trend analysis, 2017 is:

*A Post-Election Year

*Year “7” in the Decennial Calendar

For what follows we will use monthly closing prices for the Dow Jones Industrials Average starting in 1889 (yes, I said 1889).

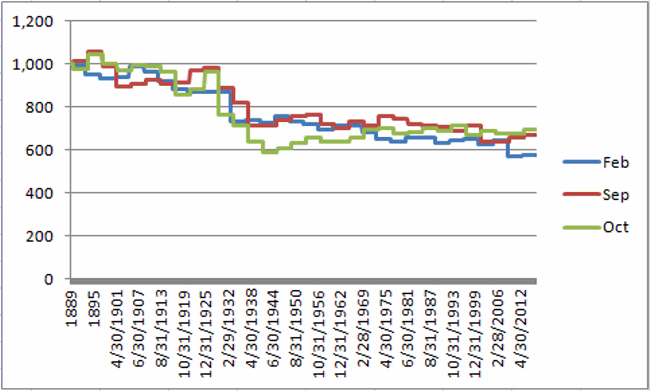
For reasons I cannot explain the months of February, September and October are the only months that have lost money on the whole during both Post-Election years and during Years ending in “7” (1897, 1907, etc.).

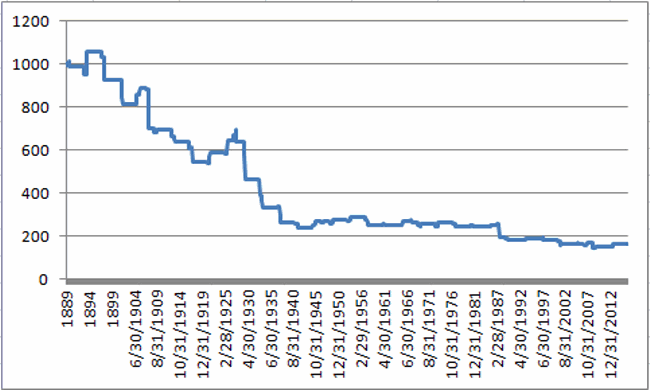
Figure 1 displays the growth of $1,000 invested during the months of February, September and October during Post-Election years starting with 1889.1Figure 1 – Growth of $1,000 invested in Dow Industrials during February, September and October of Post-Election Years only starting in 1889

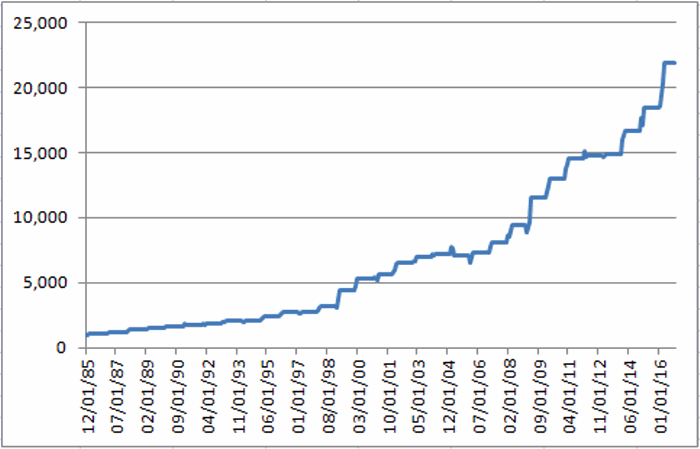
Figure 2 displays the growth of $1,000 invested during the months of February, September and October during Years ending in “7” starting with 1897.2Figure 2 – Growth of $1,000 invested in Dow Industrials during February, September and October of Years ending in “7” only starting in 1897

As you can see in Figures 1 and 2, for some inexplicable reason during these 3 months during these 2 “types” of years, the Dow just doesn’t seem to ever do much to the upside.

Now let’s put these Years and Months together. For the next test we will assume that:

*We buy and hold the Dow Jones Industrials Average ONLY during the months of February, September and October

*ONLY during Post-Election years and in Years ending in 7.

*We start with $1,000 on 12/31/1888

Figure 3 displays the results.3Figure 3 – Growth of $1,000 invested in Dow Jones Industrial Average only during months of February, September and October during Post-Election years and Years ending in “7”

The net result – a cumulative loss of -84%.

For the record:

*# of times these 3 months showed a cumulative gain = 15 (39%)

*# of times these 3 months showed a cumulative loss = 23 (61%)

*Average gain during positive years = +5.2%

*Average loss during negative years = (-10.2%)

While the chart in Figure 3 suggests a steady long-term decline during these unfavorable months, the reality is that these 3 months only register a net loss in 3 out of every 5 Post-Election years or Years ending in 7.

Summary

The results above fit neatly into the “Well it’s interesting and sort of seems important, but what exactly am I supposed to do with this knowledge?” category.

So what is in investor to do?  Move to cash during February, September and October this year? Well that’s one approach.  Overkill? Perhaps.  Another approach might be to consider hedging if the market begins to roll over, particularly during the often troublesome months of September and October.

The concerns for September and October do dovetail with the cautionary tale told in this previous article.

Jay Kaeppel

A Two-Fund Portfolio for the Next 3 Months

Technology being what it is today, if you want investing to be rocket science, it can be done.  You can fill your desk with enough quote screens to resemble NASA mission control back in the day.

(See also Seasonality in the Bond Market? You Bet)

But it sure doesn’t have to be done that way.  Consider the following…

A Two-Fund Portfolio for February/March/April

Let’s look at the historical Feb/Mar/Apr performance of this pairing:

*Fidelity Select Energy Services (ticker FSESX)

*Fidelity Select Chemicals (ticker FSCHX)

For our test:

*Put 50% in each fund on the last day of January

*Sell both funds on the last day of April

Figure 1 displays the growth of equity using this approach starting in 19861-24-17 1Figure 1 – Growth of $1,000 split 50/50 in FSESX and FSCHX during Feb/Mar/Apr since 1986

For the record:

*Number of years showing a gain = 28 (90%)

*Number of years showing a loss = 3 (10%)

*Average Gain = +12.1%

*Average Loss = (-1.5%)

*Largest Gain = +40.1% (1999)

*Largest Loss = (-2.2%) (1997)

Figure 2 displays the year-by-year results.

Year 3-Month % +(-)
1986 5.9
1987 14.6
1988 17.8
1989 7.7
1990 4.9
1991 8.5
1992 4.6
1993 13.7
1994 (0.9)
1995 15.5
1996 15.0
1997 (2.2)
1998 17.8
1999 40.1
2000 20.6
2001 5.0
2002 16.5
2003 5.6
2004 3.2
2005 (1.3)
2006 2.7
2007 11.1
2008 16.9
2009 22.9
2010 12.1
2011 11.9
2012 1.6
2013 1.1
2014 11.4
2015 11.1
2016 18.6

Figure 2 – Year-by-Year Results

Summary

This “method” has generated a gain during each of the past 11 years.  Is 2017 the year that Murphy’s Law steps up and slaps this simplistic idea across the head?  As a guy who has written 3 consecutive articles (the prior two are here and here) extolling the virtues of the energy sector is Feb/Mar/Apr it wouldn’t surprise me a bit.

Jay’s Trading Maxim #206 clearly states: Murphy hates you.  Plan accordingly.

(See also January Showdown – Murphy vs. Munis)

So please remember that this blog does not make “recommendations”, it simply relays information. Nothing that appears above should be taken to imply that this simple portfolio is sure to make money during Feb/Mar/Apr of 2017 (Yes, I am invoking the dreaded “Historical performance does not guarantee future results” caveat).

Still, as far as historical results go, I’ve seen worse.

Jay Kaeppel

When to Feel ‘Energetic’ (or NOT)

If you are looking for a market sector with some serious seasonal trends, look no further than the energy sector.  In this article, I noted the bullish tendency for ticker FSESX during the months of February, March and April.  In this piece, we will add one more “favorable” month and then also look at a 6-month “unfavorable” period.

For the record, the information that follows is not being recommended as a standalone strategy.  It is presented simply to make you aware of certain long-term trends that have been very persistently bullish (or bearish as the case may be) in the energy sector.

(See also Why You Should Be Rooting for a Bullish January)

4 Favorable Months

*The four “favorable” months for our test are February, March, April and December

Figure 1 displays the growth of $1,000 invested in ticker FSESX only during these four months every year since 1986 versus simply buying-and-holding ticker FSESX.1Figure 1 – Growth of $1,000 invested in FSESX only during Feb, Mar, Apr, Dec every year since 1986

Starting in 1986, an initial $1,000 investment grew to $76,019 (or +7,500%) versus $10,237 (or 923%) using a buy-and-hold strategy.

6 Unfavorable Months

The six “Unfavorable” months are June, July, August, September, October and November.

First the “positive” news:

*This 6-month period has managed to show a gain 14 times in 31 years – so by no means should you consider this period a “sure thing” loser

*During 4 separate years – 1997, 2003, 2004 and 2010 – the “unfavorable” months registered a cumulative gain in excess of +30%.

Doesn’t sound all that “unfavorable” so far does it?  But here’s the catch: Despite the occasional 30%or more gain, it is fair to refer to this 6-month period as “unfavorable” as the cumulative long-term results of buying and holding FSESX during these months has been nothing short of devastating.

Figure 2 displays the growth of $1,000 invested in ticker FSESX only between the end of May and the end of November every year starting in 1986.3Figure 2 – Growth of $1,000 invested in FSESX only during June through November every year since 1986

Starting in 1986, an initial $1,000 investment declined to just $82, or a cumulative loss of -91.8%

Figure 3 displays some comparative data between favorable and unfavorable periods as well as using a Buy-and-Hold strategy.

Measure Buy-and-Hold 4 Favorable Months 6 Unfavorable Months
Average Annual % +(-) 12.8 16.5 (-4.2)
Median Annual % +(-) 8.7 15.5 (-1.8)
Standard Deviation 33.4 20.1 24.6
# Years UP 18 26 14
# Years DOWN 13 5 17
Worst Year (-55.4) 2008 (-7.6) 1994 (-62.8) 2008
$1,000 becomes $10,237 $76,019 $82
Cumulative % +(-) +923% +7,500% (-92%)

Figure 3 – Comparative Results

Figure 4 displays the year-to-year results for a Buy-and-Hold approach versus holding only during the 4 “favorable” months or the “Unfavorable” 6 months.

Year All 12 months % +(-) 4 Favorable % +(-) 6 Unfavorable % +(-)
1986 (8.9) (5.2) (9.2)
1987 (20.7) 22.9 (40.1)
1988 (4.2) 22.8 (16.3)
1989 50.3 27.1 16.2
1990 8.7 4.9 (11.2)
1991 (19.9) 4.1 (25.0)
1992 4.9 (1.6) (1.3)
1993 16.4 24.5 (10.7)
1994 (0.5) (7.6) 3.1
1995 40.0 33.7 2.0
1996 45.9 22.5 20.8
1997 43.9 (4.9) 32.9
1998 (41.4) 26.5 (50.5)
1999 80.9 74.1 7.5
2000 51.7 77.6 (21.1)
2001 (22.4) 20.8 (32.4)
2002 2.2 26.2 (18.0)
2003 13.1 15.5 (16.0)
2004 26.2 1.2 30.2
2005 47.4 4.8 34.0
2006 (9.1) (4.1) (1.8)
2007 58.3 25.6 16.7
2008 (55.4) 10.5 (62.8)
2009 60.4 24.5 9.6
2010 31.7 21.6 33.7
2011 (18.5) 3.1 (16.8)
2012 (3.9) 0.7 9.6
2013 14.1 0.3 11.5
2014 (19.5) 7.2 (26.7)
2015 (19.7) 2.9 (17.9)
2016 44.2 28.4 20.1

Figure 4 – Yearly % +(-) for Buy-and-Hold versus 4 Favorable Months versus 6 Unfavorable Months

Summary

There is no guarantee from year-to-year results of buying and holding ticker FSESX during the “Favorable 4” months will show a gain and/or outperform the “Unfavorable 6” months. And there is by no means any guarantee that the “Unfavorable 6” will show a loss during any given year (note that 2016 saw the Unfavorable 6 generate a cumulative gain of +20.1%!).  So just remember that we are talking about some very long-term  trends here.

Still, most investors can discern the difference between:

*Favorable 4 months gain = +7,500%

*Unfavorable 6 months loss = (-92%)

This type of difference is what we “quantitative types” refer to as “statistically significant.”

Jay Kaeppel

Get Ready to Feel ‘Energetic’

It’s cold outside. That’s a good thing.  Well, if your priority is making money in energy stocks it is anyway.

(IMPORTANT NOTE on 1/16/17: A corrected Figure 2 appears in this article.  The results in  Figure 1 and Figure 3 in the original article were correct, however, the year-to-year results in Figure 2 in the original article were taken from the wrong Column of data and actually represent the returns that would have occurred if an investor had held FSESX from the end of November through the end of May every year  since 1986.  That original Figure 2 is also included below beneath the NEW corrected Figure 2).

First off, I should note that in this recent article I wrote about a potential trade to take advantage if crude oil sells off prior to mid February 2017.  This trade was labeled as purely “speculative” and involved a low dollar risk option trade.  An update on that position appears at the end of this article.

(See also Why You Should Be Rooting for a Bullish January)

Energy and Late Winter/Early Spring

For our test we will simply look at the performance of Fidelity Select Energy Services (ticker FSESX) during the months of February, March and April since the fund’s inception of trading in 1986.

Figure 1 displays the growth of an initial $1,000 investment in FSESX only during these 3 months each year.

1Figure 1 – Growth of $1,000 invested in ticker FSESX during Feb/Mar/April only; 1986-2016

Figure 2 displays the annual percentage gain/loss results generated by simply holding FSESX for the same 3 months every year.

(IMPORTANT NOTE on 1/16/17: A corrected Figure 2 appears in this article.  The results in  Figure 1 and Figure 3 in the original article were correct, however, the year-to-year results in Figure 2 in the original article were taken from the wrong Column of data and actually represent the returns that would have occurred if an investor had held FSESX from the end of November through the end of May every year  since 1986.  That original Figure 2 is also included below beneath the NEW corrected Figure 2).

NEW Corrected Figure 2 (as of 1/16/17) forFeb/Mar/Apr

Year % +(-)
1986 (6.2)
1987 14.1
1988 17.5
1989 12.7
1990 8.6
1991 7.6
1992 2.6
1993 25.0
1994 (3.2)
1995 19.5
1996 20.5
1997 (5.7)
1998 24.8
1999 55.3
2000 35.8
2001 7.2
2002 25.6
2003 3.2
2004 2.5
2005 1.5
2006 0.2
2007 17.9
2008 25.2
2009 19.5
2010 11.6
2011 9.5
2012 (1.3)
2013 (0.1)
2014 14.5
2015 16.6
2016 20.3

Figure 2  – Total Return % +(-) for FSESX during Feb/ Mar/Apr since 1986

For the record (Corrected Figure 2 for Feb/Mar/Apr):

-# of years that showed a gain = 26 (84% of the time)

-# of years that showed a loss = 5 (16% of the time)

-Average UP year = +13.5%

-Average DOWN year= -3.3%

NOTE: Below is Figure 2 from the original  article which were taken from the wrong Column of data.  The results in the Figure 2 below represent the gain/loss from holding FSESX from the end of November to the end of May every year since 1986.

Year %+(-)
1986 (7.2)
1987 47.2
1988 19.0
1989 37.2
1990 14.6
1991 2.0
1992 4.8
1993 35.4
1994 (2.6)
1995 38.1
1996 23.4
1997 14.4
1998 1.6
1999 60.6
2000 90.4
2001 16.9
2002 21.1
2003 28.1
2004 3.7
2005 15.0
2006 10.7
2007 33.0
2008 (1.0)
2009 47.8
2010 (4.3)
2011 5.1
2012 (6.4)
2013 14.3
2014 3.5
2015 (10.3)
2016 13.7

Figure 2 – Annual% +(-) from holding ticker FSESX during Feb/Mar/April only; 1986-2016

For the record:

-# of years that showed a gain = 25 (81%of the time)

-# of years that showed a loss = 6 (19% of the time)

-Average UP year = +24.1%

-Average DOWN year= -5.3%

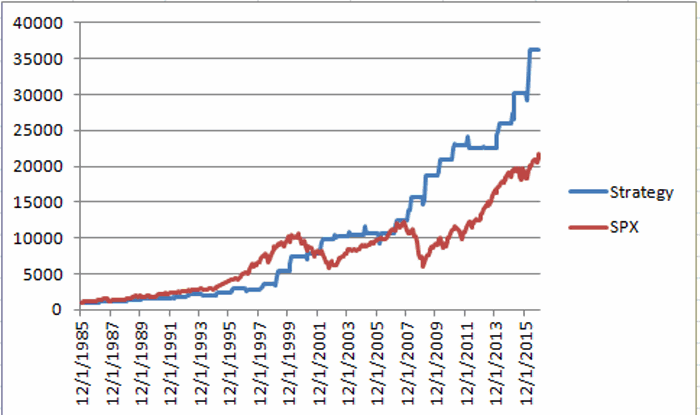
To put the power of this seasonal trend into perspective, Figure 3 displays the results of the following test:

*Buying and holding FSESX during Feb. Mar and Apr every year and sticking the money in a mattress the rest of the year (Strategy – blue line)

*Versus buying and holding the S&P 500 Index (SPX – red line)

3Figure 3 – FSESX Seasonal 3-months a year strategy versus buy/hold using SPX

Summary

The good news is that this has shown to be an extremely powerful (and profitable) seasonal trend.  The bad news is that none of this guarantees that energy stocks will generate a gain during this 3-month period in 2017.

Still, it’s something to think about.

Update on USO Option Trade

The jury is still out on the trade I wrote about here. In Figure 4 below you can see that ticker USO and the option position itself are roughly unchanged from the time of entry. 4Figure 4 – Long USO Feb 13 puts (Courtesy www.OptionsAnalysis.com)

The bottom line: if USO rallies between now and mid-February, this trade will lose money.  If USO declines from current levels a profit is possible.

Jay Kaeppel