The fourth quarter of the year has a history of being bullish for the stock market (although, sadly, there are no guarantees). Certain sectors have shown a very persistent bullish trend within the 4th quarter. So let’s highlight a few examples.
See also Down the Oil Well One More Time
5 Sector Trends of Note
We will focus on 5 Fidelity Select Sector funds (although Rydex funds, Profunds and/or ETFs can be used as an alternative). All 5 sectors highlighted in Figure 1 begin a favorable seasonal period on the close of October Trading Day #19 (10/27/2016 this year).
|
Sector |
Start Month |
Start (close of) Trading Day #… |
End Month |
End (close of Trading Day # |
| FCYIX | October | 19 | December | 3 |
| FSCGX | October | 19 | January | 6 |
| FSCPX | October | 19 | December | 22 |
| FSHOX | October | 19 | January | 1 |
| FSPHX | October | 19 | December | 6 |
Figure 1 – Seasonally Favorable Sectors
The year-by-year results for each Sector/Time Period combination appears in Figure 2.
| Year | FCYIX | FSCGX | FSCPX | FSHOX | FSPHX |
| 1989 | 0.5 | 4.8 | |||
| 1990 | 16.0 | 9.1 | |||
| 1991 | 7.6 | 2.7 | |||
| 1992 | 3.2 | 10.1 | 11.0 | ||
| 1993 | 7.7 | 3.1 | 6.4 | 1.6 | |
| 1994 | 9.3 | (1.3) | (1.7) | 1.8 | |
| 1995 | (0.7) | 6.5 | 12.8 | 6.1 | |
| 1996 | 3.5 | 1.1 | (0.5) | 4.6 | |
| 1997 | 11.3 | 12.9 | 3.3 | 8.7 | |
| 1998 | (4.4) | 16.4 | 17.9 | 8.8 | |
| 1999 | 4.3 | 13.8 | 13.1 | 8.7 | 0.1 |
| 2000 | 10.3 | 11.2 | 5.4 | 18.7 | 1.0 |
| 2001 | 10.9 | (0.2) | 6.9 | 17.6 | (0.9) |
| 2002 | 3.9 | 5.4 | (5.1) | 5.5 | (1.2) |
| 2003 | 7.6 | 13.8 | 4.9 | 4.9 | 3.9 |
| 2004 | 9.1 | 4.4 | 9.8 | 14.9 | 4.6 |
| 2005 | 10.2 | 19.3 | 7.9 | 14.3 | 7.9 |
| 2006 | 2.0 | 6.8 | (1.6) | 6.4 | (0.8) |
| 2007 | (2.0) | 16.1 | (8.1) | (10.1) | 2.0 |
| 2008 | 6.1 | 4.3 | 14.8 | 32.5 | 4.7 |
| 2009 | 5.9 | (6.6) | 8.0 | 7.9 | 3.6 |
| 2010 | 7.6 | 14.3 | 8.8 | 17.3 | 4.9 |
| 2011 | (1.4) | 14.2 | (3.8) | 5.3 | (2.6) |
| 2012 | 3.1 | 15.3 | 2.8 | 8.8 | 1.0 |
| 2013 | 1.6 | 2.4 | 6.1 | 2.1 | 6.0 |
| 2014 | 6.3 | 8.5 | 9.3 | 7.0 | 7.4 |
| 2015 | 1.5 | 5.5 | (1.9) | (0.8) | 4.8 |
Figure 2 – Year-by-Year Results
The performance results for each Sector/Time Period combination in Figure 1 appears in Figure 3.
| FCYIX | FSCGX | FSCPX | FSHOX | FSPHX | |
| Month Start | Oct | Oct | Oct | Oct | Oct |
| TD Start | 19 | 19 | 19 | 19 | 19 |
| Month End | Dec | Jan | Dec | Jan | Dec |
| TD End | 3 | 6 | 22 | 1 | 6 |
| # Up | 15 | 19 | 18 | 23 | 23 |
| # Down | 2 | 4 | 6 | 4 | 4 |
| % times UP | 88.2 | 82.6 | 75.0 | 85.2 | 85.2 |
| % Times Down | 11.8 | 17.4 | 25.0 | 14.8 | 14.8 |
| Average% +(-) | 5.1 | 7.6 | 5.0 | 8.6 | 3.9 |
| Median %+(-) | 5.9 | 7.7 | 5.8 | 7.6 | 4.6 |
| Max. % Gain | 10.9 | 19.3 | 16.4 | 32.5 | 11.0 |
| Max. % Loss | (2.0) | (6.6) | (8.1) | (10.1) | (2.6) |
Figure 3 – Summary Results
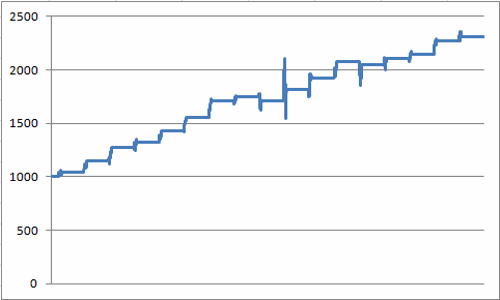
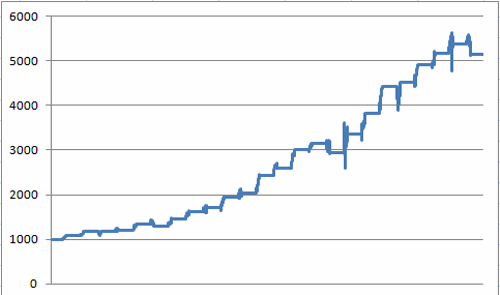
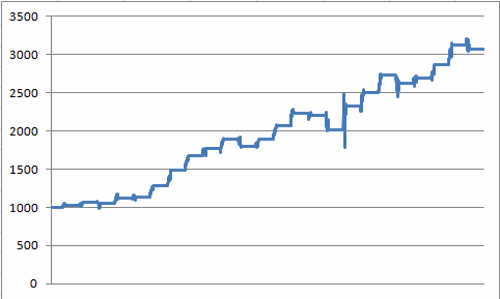
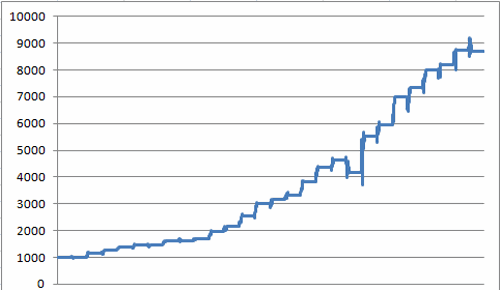
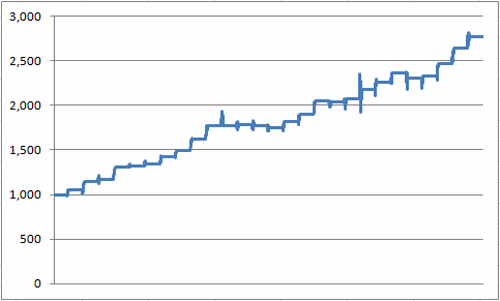
The following charts show the growth of $1,000 invested in each sector fund only during the seasonally favorable period designated in Figure 1.
Equity Curve for ticker FCYIX (1999-present)
Equity Curve for ticker FSCGX (1992-present)
Equity Curve for ticker FSCPX (1992-present)
Equity Curve for ticker FSHOX (1989-present)
Equity Curve for ticker FSPHX (1989-present)
Summary
The 4th quarter has generally been kind to the sectors highlighted above. That’s the Good News. The Bad News is that – as always – there is absolutely no guarantee that any of these sectors will rise in price between now and the end of the “seasonally favorable” period designated in Figure 1.
Jay Kaeppel


Jay, this is most interesting. What does the data reveal for the other quarters?
Best!