As the name implies, this article is written with option traders in mind. That being said, if you are looking for new and different ways to trade the markets, you may find the following interesting .
(See also Special Offer for JayOnTheMarkets.com readers from www.OptionsAnalysis.com)
My colleague in the American Association of Professioal Technical Analyts (AAPTA), Wayne Whaley of Witter & Lester (Wayne is probably the best analyst of seasonal trends that I know of) put out a piece to his subscribers in early September highlighting a study that shows that a particularly bearish setup had occurred in crude oil. Because his subscribers pay money for his analysis I’ll not reveal the methodology. But the point is that following this particular setup the price of crude oil has declined between September 6th and December 6th in 14 of the 15 previous instances. Things that have been 93% accurate tend to catch my eye.
I did not immediately do anything with this information. From there crude oil rallied, declined and then rallied again. Which led me to the following idea:
*Let’s say that based on Whaley’s research you are willing to risk a certain amount of money on the possibility that crude oil will decline over the next several months.
*To be clear, we are not predicting a “collapse” or even a sharp decline per se in the price of crude – just that the price of crude will be somewhat lower in then than it is now.
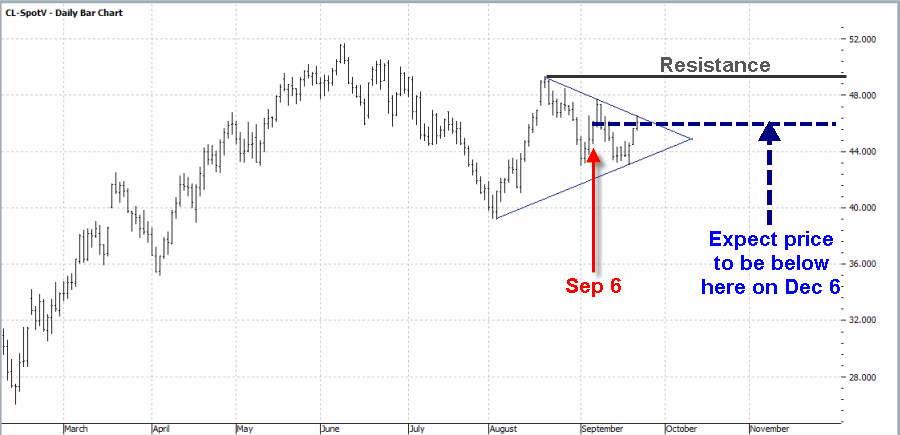
Based on this outlook, there is a particular – though less often used – option strategy that make sense. I will refer to it as the “in the money bear put”. The chart for spot crude oil on 9/22 appears in Figure 1. Figure 1 – Spot Crude Oil prices (Courtesy ProfitSource by HUBB)
A few things to note from Figure 1:
*We see the price for crude on 9/6 and want to enter a trade that stands to make money if crude is below this price (by any amount) on December 6.
*We can also see that there is a natural resistance level at the August high. We can consider using this as a stop-loss point.
*Price has been “coiling” of late, and has hit the declining trend line for the triangle drawn in Figure 1. Does this guarantee that price is about to fall? Not at all. But for a trader looking to play the short side it is as good a time as any to “get in the game.”
The Trade
Rather than trading in the futures market, we will instead look at trading put options on ticker USO, an ETF that is designed to track the price of crude oil.
The trade highlighted below involves:
*Buying 22 Dec USO 12.5 puts
*Selling 20 Dec USO 11 puts
The particulars appear in Figure 2 and the risk curves in Figure 3 Figure 2 – USO Dec 12.5-11 bear put spread (Courtesy www.OptionsAnalysis.com)
 Figure 3 – Risk Curves for USO Dec 12.5-11 bear put spread (Courtesy www.OptionsAnalysis.com)
Important things to note:
*These options are not heavily traded at the moment and the position was entered using a limit order using the midpoint of the bid/ask spreads for each option.
*This trade cost $2,650 to enter. To mitigate the risk of losing this entire amount I am choosing a stop-loss point of $11.60. If USO rallied immediately to $11.60 this trade would get stopped out with a loss of -$686 to -$1,140, depending on whether this stop-loss is hit later or sooner (see Figure 4). Note that this stop-loss is arbitrary. It is not necessary to use a stop-loss. However, if you employ no stop-loss method at all then you risk the entire $2,650.
*The breakeven price for this position is $11.30, which is close to the August high for USO of $11.38. At any price below $11.30 this trade will show a profit.
*If crude oil were to fall two standard deviations (to $7.20) this trade would earn roughly +$1,400.
*If USO were to remain unchanged from its price at the time of entry ($10.53 a share), this trade will show a profit of $738
Zooming In
Figure 4 depicts a closer look at the risk curves – and the attendant profit/loss implications – shown in Figure 3. Figure 4 – Risk Curves for USO Dec 12.5-11 bear put spread (Courtesy www.OptionsAnalysis.com)
Assuming a stop-loss price of $11.60 or USO is used (and again this is arbitrary with the following pros and cons: Using a stop-loss it is possible to get stopped out and then have price reverse back down and miss a potentially profitable trade; Not using a stop-loss – or using a higher price for USO as a stop-loss point – exposes you to greater dollar risk):
*Our maximum likely profit potential is roughly $1,400 (if USO plummets two standard deviations to $7.20 a share.
*Our maximum likely dollar risk – assuming we use a stop-loss of $11.60 for USO shares, is roughly -$1,140 (although that dollar figure would get smaller as time goes by due to time decay).
Summary
So is this trade a good idea? The truth is that that question can’t be answered except in hindsight. Still, is this trade a good example of one way to:
*Play a situation where you expect a given security to decline – even if only slightly
*While allowing for larger profits if there is a larger decline
*While also limiting the amount of dollar risk to an acceptable level?
Well sure my opinion is a little biased, but I am going to go ahead anyway and say “yes.”
Jay Kaeppel

