Monthly Archives: February 2016

3 Reasons to be Bullish on 2016 (and 2 Reasons to be Scared as Hell)

As I wrote about here and here, at any and all given points in time it is possible to make a plausible bullish case and a plausible bearish case.  This is just as true now as it was, well, last week.

3 Reasons to Expect a Bullish 2016

#1. The JK HiLo Index

For the first reason I simply refer you to the article I wrote last week that included a discussion of my own JK HiLo Index.  As I wrote then, that index recently fell to an extremely low (i.e. bullish) level.  It should be noted that in 2008 this indicator gave a bullish signal well before the market ultimately reached its low.  So this is no “sure thing” by any means.  But it does tell us that the stock market did reach a “washed out” level early in 2016.

#2. “Escape Velocity”

For this I refer you to a 2/25/16 MarketWatch article written by Simon Maierhofer.  In the article Maierhofer reveals a little known signal that generated a buy signal on 2/17/16.  The indicator has generated only 8 previous signals since 1970.

Some of the signals were followed by short-term declines however:

1) In all 8 instances the S&P 500 Index was higher 12 months later

2) The average 12-month gain after the signal was +20.82%.

Definitely worth a read.

#3. Last 7 Months of An Election Year

The stock market has showed a strong tendency to gain ground during the last seven months of a presidential election year.  I wrote about this on Page 197 of my book “Seasonal Stock Market Trends”.  For the record, using the Dow since 1900 the last 7 months of the presidential  election year was:

*”Up” 22 time

*”Down” 6 times

During 14 of the last 16 presidential election years the S&P 500 has gained ground during the last 7 month of the year.

This trend was also covered recently in expert detail by Jeffrey Hirsch of The Stock Trader’s Almanac.   He correctly noted that during 14 of the last 16 presidential election years the S&P 500 has gained ground during the last 7 month of the year.

One important caveat here: The last “loser” was 2008 and as you may recall it was pretty awful.  So this is clearly no “sure thing.”  Still, 14 out of 16 is statistically significant.  Just remember that a stop-loss is always a good idea.

2 Reasons to be Scared as Hell

#1. Ominous Signs spotted by one market expert

Thomas DeMark is a name known to many stock market followers.  This article details why he is expecting potential trouble in the month of March.

#2. As always – China

A lot of analysts have been predicting anything from “trouble” to “Armageddon” based on the economic goings on in the country of China.  My personal opinion is that there is a painful day of reckoning “out there” somewhere the way. But in all candor I have no idea if that day is coming “sooner” or “later.”  But if you want to gain an understanding of the trouble that may be brewing in the Far East I suggest you read this article by David Stockman, which explains in great detail the dangers that are building.

Jay Kaeppel


JayOnTheMarkets.com: Is the Stock Market about to Tank – or Soar? (Part II)

In Part I I sort of intimated that the bottom is about to drop out from under the stock market.  And let’s face it – that is possible.  But as I also mentioned, there is always countervailing information.  To wit:

Why the Stock Market is About to Soar

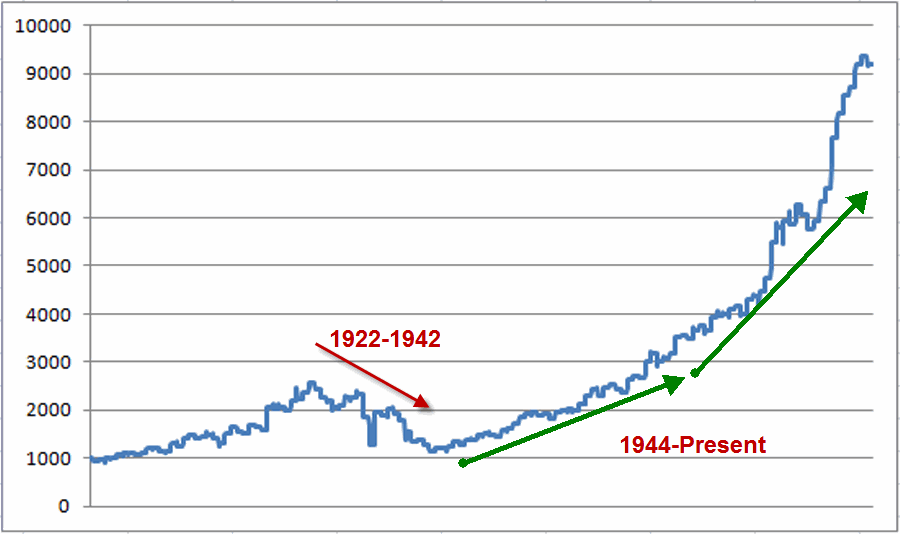
Getting a sell signal at the end of February is a little disconcerting simply because the March/April time period has historically been pretty good for stock market investors.  Figure 1 displays the growth of $1,000 invested in the Dow Industrials Average only during the months of March and April, every year since 1886.1bFigure 1 – $1,000 invested in Dow during March/April (1886-2015)

A few notes regarding March/April:

Since 1886:

*Up 83 times (64%)

*Down 47 times (36%)

*Average “Up” = +6.12%

*Average “Down” = -5.13%

Things have improved a bit since 1944:

*Up 53 times (75%)

*Down 18 times (25%)

*Average “Up”= +5.16%

*Average “Down” = -3.28%

So there has been an upside bias historically during the March/April time frame.  In addition, we have already seen a steep selloff in the stock market and a number of “overbought/oversold” indicators that I follow all reached “extremely oversold” territory.  This type of action typically – though certainly not always – presages favorable stock market activity.  Rather than showing you a bunch of different oscillators all with essentially the same “oversold” squiggly lines, let’s just highlight one of my favorites.

The JK HiLo Index

I first wrote about this indicator in the October 2011 issue of Technical Analysis of Stocks and Commodities magazine and I believe it is available via Bloomberg. The calculations are as follows:

A = the lower of Nasdaq daily new highs and Nasdaq daily new lows

B = (A / total Nasdaq issues traded)*100

C = 10-day average of B

D = Nasdaq daily new highs / (Nasdaq daily new highs + Nasdaq daily new lows)

E = 10-day average of D

JK Hi/Lo Index = (C * E) * 100

In a nutshell:

*High readings (90 or above) suggest a lot of “churning” in the market and typically serve as an early warning sign that a market advance may be about to slow down or reverse

*Low readings (20 or below) indicate a potential “washout” as it indicates a dearth of stocks making new highs

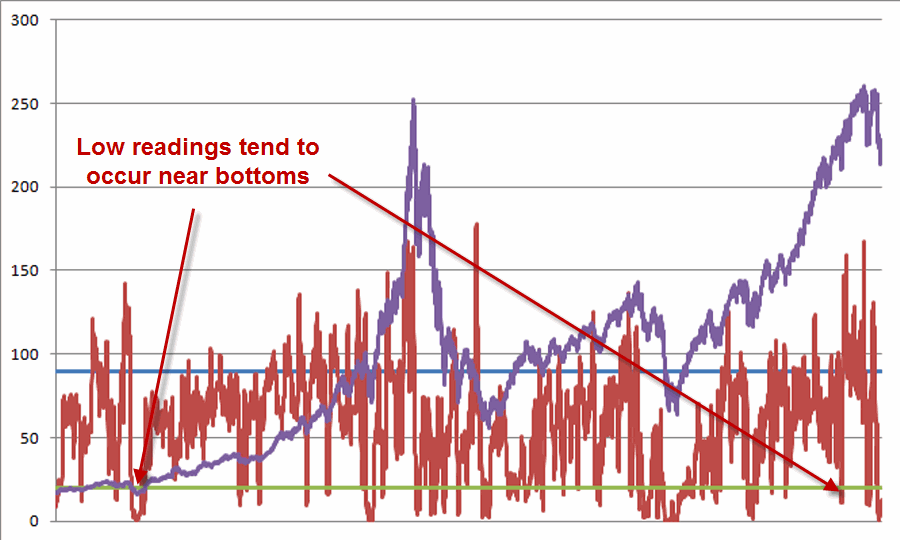
Figure 2 displays the Nasdaq Composite (divided by 20) with the JK Hi/Lo Index plotted since 1988.

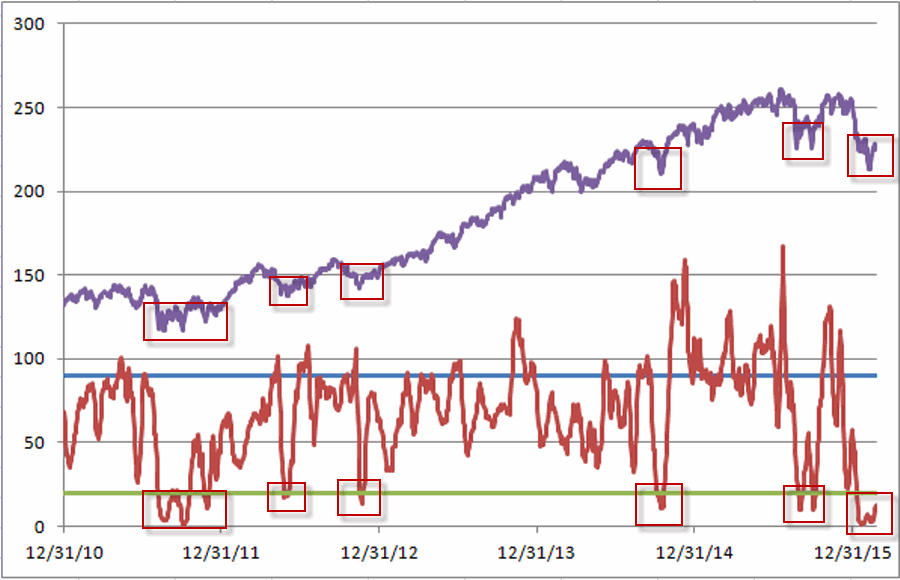
Figure 3 zooms in a bit to show the action since 2011

2bFigure 2 – JK HiLo Index (red line) versus Nasdaq Composite (/20) since 1988

3b

Figure 3 – JK HiLo Index (red line) versus Nasdaq Composite (/20) since 2011

As you can see, low indicator readings often occur near market lows.

So the market is:

A) Oversold (JK Hi/Lo Index recently bottomed out at 0.86 and presently stands at 12.5)

B) Heading into a typically bullish time period (March/April)

Given this, one might argue that the stock market is about to stage a meaningful advance. Which of course, flies directly in the face of what was presented in Part I.

Summary

So what should any trader or investor do given conflicting signals?

Simple…keep following your well thought out investment plan. You do have one, right?  In any event, remember:

Jay’s Trading Maxim #2: The keys to trading and investment success are, A) utilizing a method or methods that have a realistic expectation of generating profits over the long run, and B) having the financial and emotional wherewithal to follow your method(s).

Jay Kaeppel


Is the Stock Market about to Tank – or Soar?

The most fascinating thing about the stock market is that at every single point in time it is possible to make a compelling bullish case…..and a compelling bearish case.  Don’t’ believe me?  Go ahead and scan the internet for “bullish” and “bearish” arguments regarding the future prospects for the market.  But maybe have a sandwich handy – it may take awhile to get through it all.

(See also Is the Stock Market about to Tank – or Soar? (Part II))

Why the Stock Market is About to Tank

Having been in the market for awhile (i.e., since the “Hair Era” in my life to the “Not So Much Hair Era” in my life) I have explored moving averages about as much as a person can.  Let me sum up what I have learned in the fewest words possible:

Moving averages can be:

A) Extremely useful at times

B) Horribly wrong at other times

That is pretty much everything you need to know.  In other words, there are no “perfect” moving average schemes.  You have to take the bad with the good.  To wit, one moving average method that I use is designed simply to keep the portfolio out of the stock market during some portion of an extended bear market decline.  And historically it has done an excellent job of it over time.  It also does get whipsawed from time to time.  Painfully so at times.

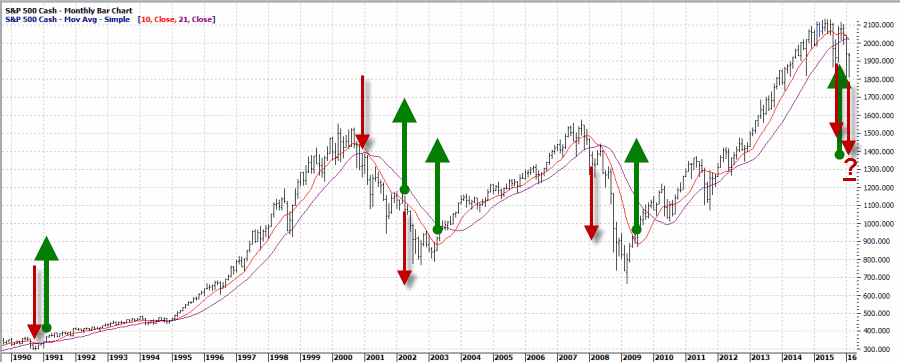
The Buy and Sell rules are quite simple:

*Sell when the S&P 500 Index (SPX) closes two consecutive months below its 21-month moving average AND also closes below the 10-month moving average

*Buy when SPX closes back above the 10-month moving average

Figure 1 displays the buy and sell signals using this method since 1990.1aFigure 1 – Buy and Sell Signals for SPX using Jay’s Market Trend Filter

The good news is that it had an investor out of stocks during the bulk of the 2000-2002 and 2008-2009 bear markets, therefore avoiding some spectacular drawdowns.  The bad news is that it got whipsawed in 1990 and again (painfully) in 2015.  A sell signal occurred at the end of September, the stock market rallied very sharply in October (while this “system” was out of the market) and a new buy signal occurred at the end of October. Since then the market has been awful and now a new sell signal is likely at the end of February 2016.

Repeating now, Moving averages can be:

A) Extremely useful at times

B) Horribly wrong at other times

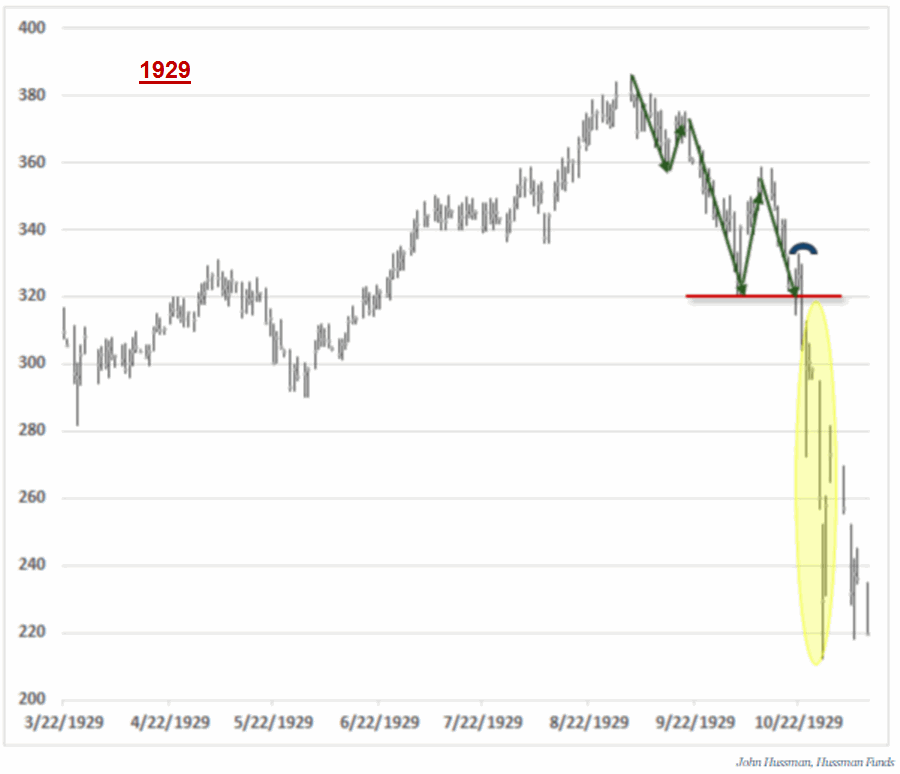
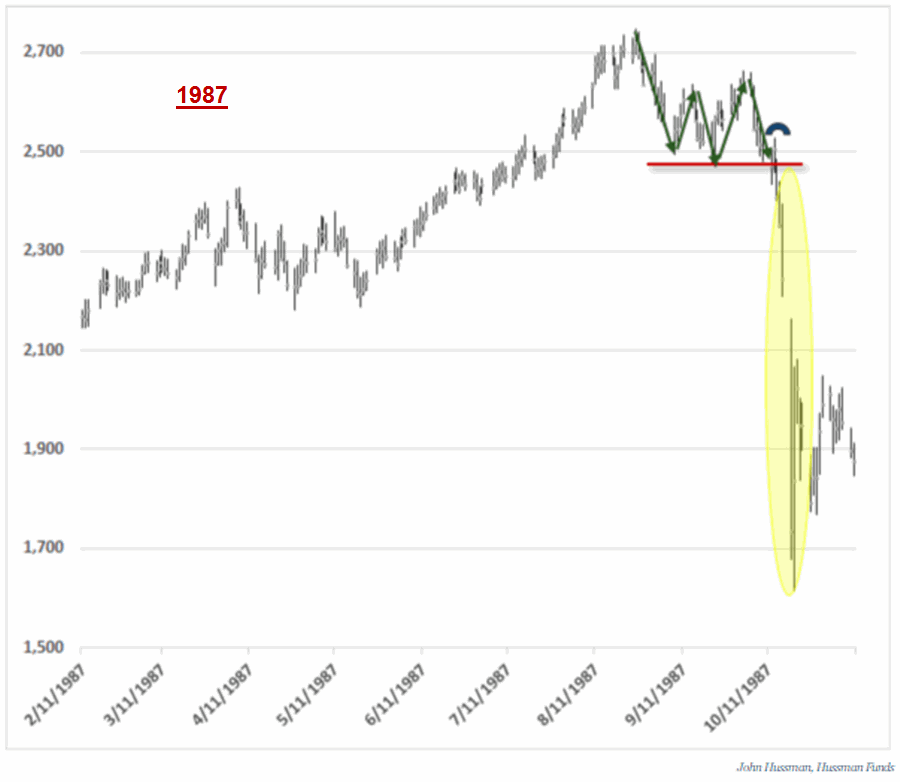
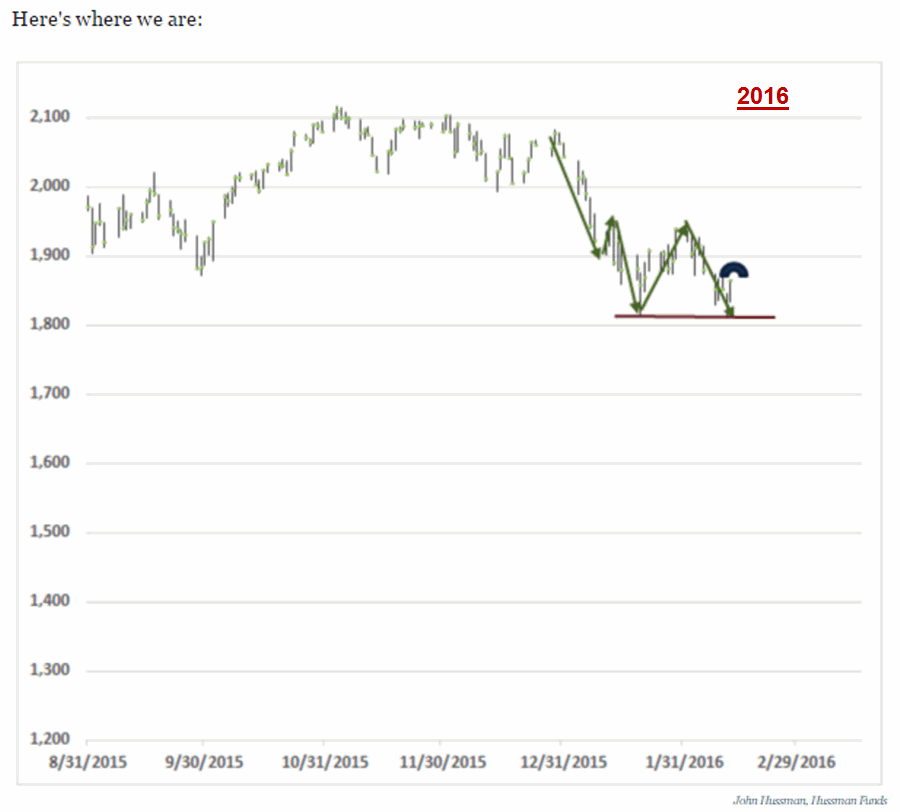
Will this new “sell” signal prove “useful” or “wrong”?  One notion that may buttress the bearish case is laid out in this article by John Hussman which compares the action in 1929 and 1987 “pre-crash” to 2016.  I encourage you to read the article in its entirety however, to make the point see Figures 2, 3 and 4 below.2aFigure 2 – Stock market 1929 (Source: John Hussman)3aFigure 3 – Stock market 1987 (Source: John Hussman)

4aFigure 4 – Stock market 2016 (Source: John Hussman)

So are we headed for the next great “Crash”?  And will a moving average sell signal at the end of February prove prescient?

Only time will tell.  Before panicking please note that in my next piece I will highlight a few reasons to expect a market rally in the near future instead of a crash.

(See also Is the Stock Market about to Tank – or Soar? (Part II))

Jay Kaeppel


An Update on ‘One Way to Play a Spike in SPY Volatility’

In this article dated 2/10/16, I highlighted an example of one way to play volatility using options on SPY.  This is an update to that article and is intended simply to educate traders on how to handle trades as they evolve.

(See also One Way to Play Crude Oil Volatility)

The Original Trade

The particulars of the original trade appear in Figure 1.1Figure 1 – SPY Bull put spread (Courtesy www.OptionsAnalysis.com)

In a nutshell, the maximum profit potential is $456 and a trader would likely want to cut his or her loss if SPY dropped below $177.24 a share.

The Update

As I write, SPY has rallied is now trading at $192.98 and the trade is showing an open profit of $414 with 9 days left until expiration as shown in Figure 2.

2Figure 2 – Updated SPY Bull put spread (Courtesy www.OptionsAnalysis.com)

Questions:

As you can see there is $42 of additional profit potential available.

*Is it worth it to hang on for 9 days in hopes of garnering those additional dollars?

*Or is it best to exit now, take the profit and run, and eliminate all downside risk?

The truth is that there is no right or wrong answer and each individual trader would have to make his or her own decision.  For what it is worth, given that:

*Holding on essentially involves a potential reward of $42 versus a potential risk of somewhere between $800+ and $2,308, and;

*SPY is below its 200-day moving average, so it is fair to characterize this advance as a “rally in a bear market” (no prediction here, just noting that bear market rallies have a way of reversing quickly and painfully);

*I for one would take my profit and move on.

But if you are an option trader or considering trading options, think about it some.  Because, well, as clearly stated in:

Jay’s Trading Maxim #45: One of the keys to success in trading is learning to make your own decisions (and learning to live with the consequences when things don’t go as hoped).

Jay Kaeppel


Jay’s Trading Maxim’s (Part 3)

Jay’s Trading Maxim #201: It is OK to make all the predictions you’d like regarding the financial markets.  Just don’t be stupid enough to risk a lot of money thinking that you’ll be right (more succinctly: Predicting the future is really hard).

Jay’ Trading Maxim #202: There is an incredibly fine line between courage and stupidity.  Approach that line with caution.

(See also Jay’s Trading Maxim’s (Part 1))

(See also Jay’s Trading Maxim’s (Part 2))

Jay’s Trading Maxim #206: When you find yourself becoming quite pleased and comfortable with the way things are flowing, beware the ebb.

Jay’s Trading Maxim #212a: If you’ve made the decision to “go for the gusto”, then for crying out loud man, just go for the gusto.

And the all important addendum…

Jay’s Trading Maxim #213b: “Gusto” ain’t always all it’s cracked up to be.  So if you’ve made the decision to “go for the gusto”, remember not to lose your shirt in the process.

Jay’s Trading Maxim #292: There is a difference between picking a bottom and recognizing a potential opportunity.

Jay’s Trading Maxim #293: Most truly great buying opportunities do not look anything at all like truly great buying opportunities at the time they are truly great buying opportunities.  In fact, they typically look like just the opposite.

Jay’s Trading Maxim #306: Human nature can be a detriment to trading success and should be avoided as much as humanly possible.

Jay’s Trading Maxim #306a: The Elliott Wave count can be an extremely valuable market timing tool.  Especially when it works.

See also One Way to Play a Spike in SPY Volatility)

Jay Trading Maxim #306b: If you want to know how useful Elliott Wave theory is, just go and ask any Elliott Wave theoretician (but maybe bring a sandwich because you might be there a while).

Jay’s Trading Maxim #312: “There are exceptions to every rule.” (OK, I’m pretty sure I picked this one up from someplace else, but still, you’ve got to admit that it’s got some merit).

Jay’s Trading Maxim #321: Refusing to employ some sort of stop-loss mechanism so as not to interfere with a given trading system’s performance is perfectly acceptable – right up until the time that – tragically – it is not.

(See also This is What a Classic Bottom Formation Looks Like (Maybe?))

Jay’s Trading Maxim #372: What goes up may eventually go down – but it might also continue to go up and maybe a lot more than you expect and for a really long time.  So learn to follow trends and establish objective exit criteria.

Jay’s Trading Maxim #373: What goes down may or may not eventually go back up – but it will probably bounce, at least every once in a while.

As it turns out Trading Maxim #373 is much more useful when applied to physical commodities than to individual stocks, for as we know, the price of a stock can in fact go to zero.  Virtually any physical commodity – no matter how much in abundance it may be – will maintain a price level somewhere north of zero.

One Way to Play Crude Oil Volatility

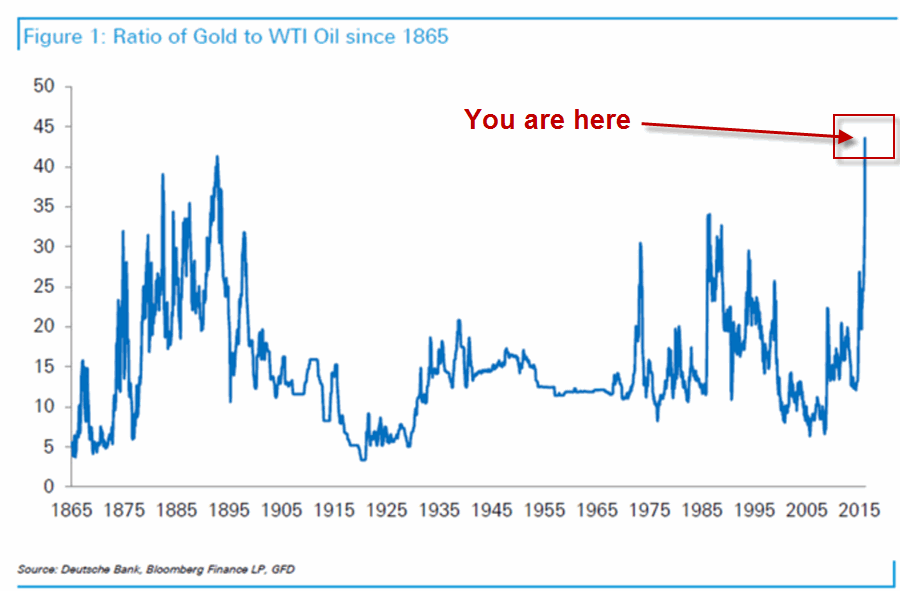
In this article I highlighted a chart that I saw in this article.  The implication of the chart is that crude oil – at least when compared to gold – is deeply oversold and undervalued.  Will that actually prove to be the case?  Sorry folks, only time will tell.

(See also Turning a Short-Term SLV Trade into a Long-Term SLV Trade

But here are 3 things we can state for sure about crude oil right now:

1. The oil market has been in a free fall since May of 2015 and there is no way to accurately forecast when “the bottom” will occur. See Figure 1.

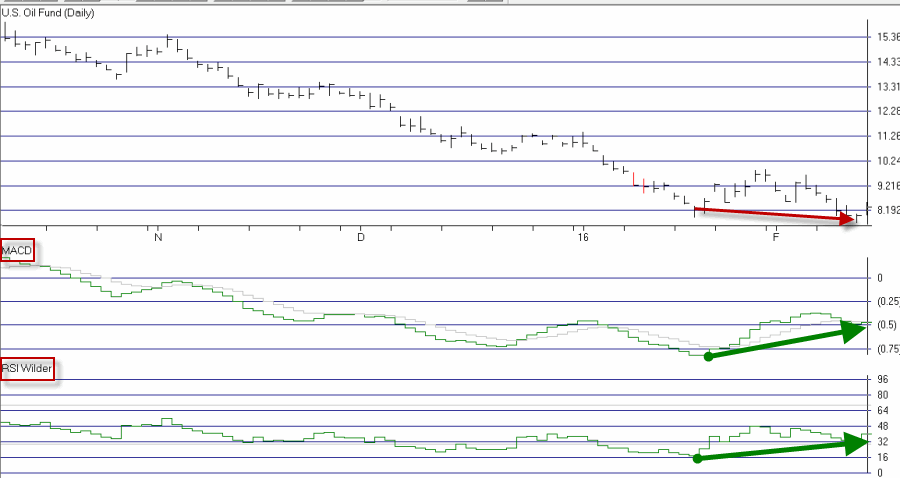
2. That being said, we can also state that crude oil is extremely oversold and that several momentum indicators may be forming a bullish divergence.  See Figure 2.

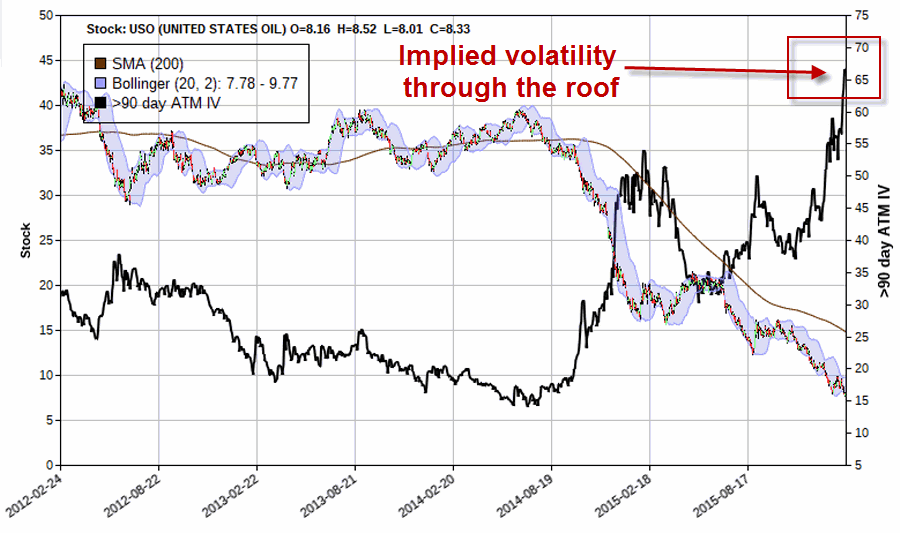
3. We can also state unequivocally that the implied volatility for options on ticker USO – an ETF that tracks the price of crude oil) is at an extremely high level (which tells us that there is a lot of time premium built into the price of USO options.  See Figure 3.

The high level of implied volatility in this case indicates that there is a lot fear and uncertainty in the oil market and option traders are willing to pay a lot in order to hedge the risks they perceive to exist.1Figure 1 – Long-term decline for USO (Courtesy AIQ TradingExpert)2Figure 2 – Possible bullish divergence for RSI and MACD (Courtesy AIQ TradingExpert)

3Figure 3 – USO options implied volatility at multi-year high (Courtesy www.OptionsAnalysis.com)

Given all of this let’s look at an example of one way to play these factors.

An Example Play in USO

As always, this blog offers only “examples” and not “recommendations”.  Make no mistake that what follows fits into the category of “risky speculation.”  The good news is that a trader can apportion only a small percentage of his or her capital to a trade like this, so the overall portfolio risk is low.

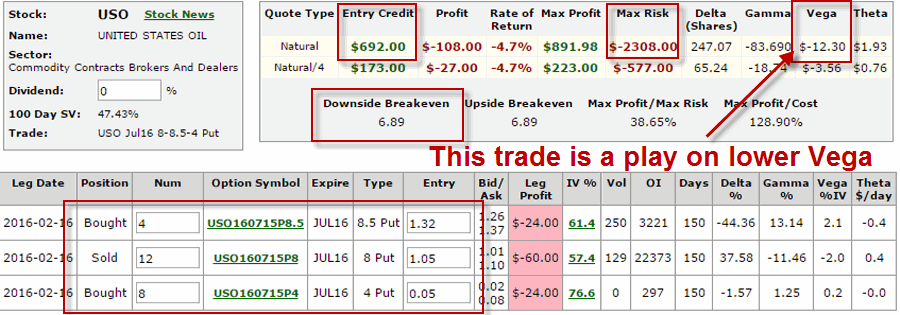
The strategy highlighted is commonly referred to as a “Modified Butterfly spread”.  The trade highlighted involves:

*Buying 4 July USO 8.5 strike price puts

*Selling 12 July USO 8 strike price puts

*Buying 8 July USO 4 strike price puts

We are trading July options for the following reason: Changes in implied volatility have a greater effect on longer-term options than on shorter-term options.

The crux of this trade is the idea that:

a) crude oil will stabilize at least temporarily, and,

b) implied volatility will decline, possibly significantly.

c) our goal is not to hold until July but to look for the first good profit-taking opportunity if implied volatility declines significantly.

The particulars are captured in Figure 4.4Figure 4 – USO July Modified put butterfly (Courtesy www.OptionsAnalysis.com)

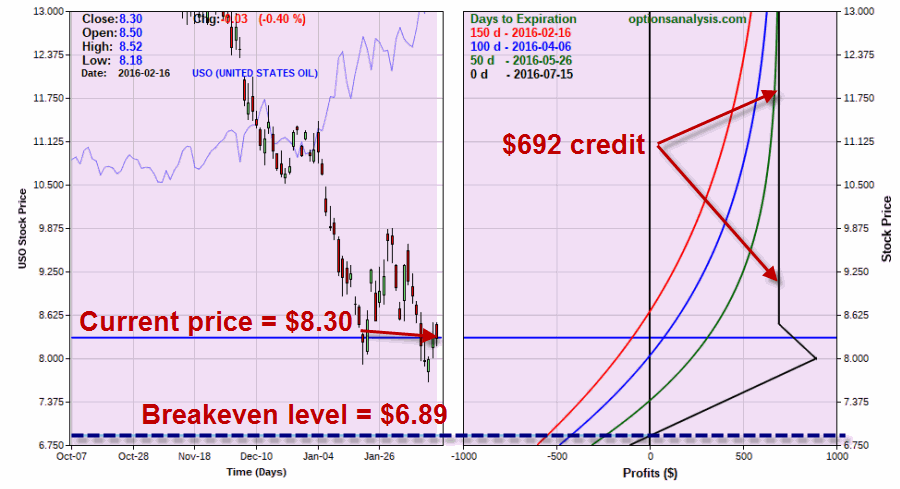
5Figure 5 – USO July Modified put butterfly risk curves (Courtesy www.OptionsAnalysis.com)

Notes:

*USO is trading at $8.35

*The breakeven price is $6.89 (17.5% below current price)

*The maximum profit is $892 (however, this would only occur if USO closed at exactly $8.00 at July option expiration)

*The original credit is $692 (this profit would be realized if USO is above $8.50 at July option expiration

*The maximum risk is $2,308, however, this would only occur if we are still holding the position at July expiration and USO is below $4.00 a share.

However:

*The primary goal (hope?) for this trade is that USO will do anything other than plunge another 17.5% AND implied volatility will fall (sharply, with any luck).

*For implied volatility were to fall back into the normal historical range for USO it would have to fall roughly 40% from current levels.  If you look again at Figure 4, in the upper right you will see a “Vega” of -$12.30.

This -$12.30 Vega value tells that:

*For each 1 point rise in volatility this trade will lose $12.30 based solely on an increase in volatility.

*It also tells us that for each 1 point decline in volatility this trade will gain $12.30 based solely on a decrease in volatility.

Thus, if implied volatility falls sharply from its current extremely high level, this trade could generate a decent profit more quickly, even if price remains relatively unchanged.

For the record, another sharp selloff in price would likely be accompanied by higher volatility which could generate a significant loss fairly quickly.  So a trader holding this position MUST be prepared to act if the worst case scenario (sharply lower price and/or sharply higher IV) unfolds.  A stop-loss somewhere below the breakeven price of $6.89 would make sense.

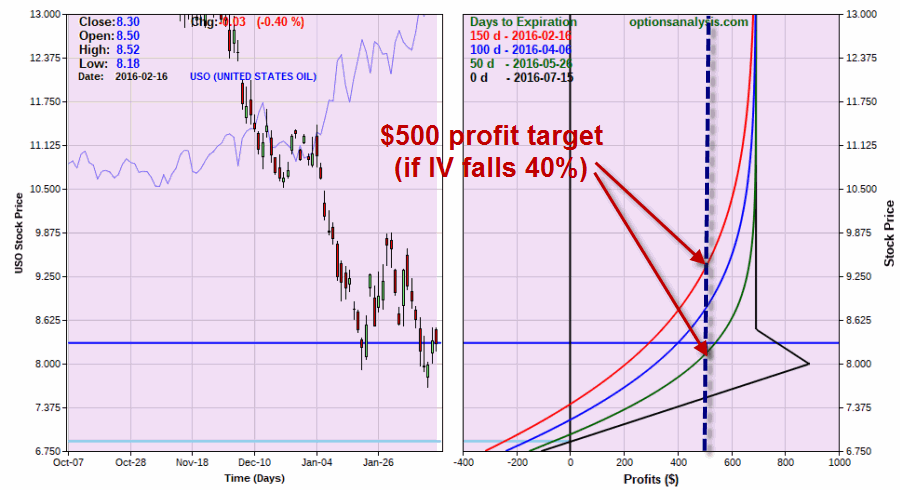
Figure 6 displays the risk curves for this trade if IV did in fact fall to 0.60 times its current level (i.e., 40% lower).6Figure 6 – Risk curves if USO option implied volatility drops dramatically (Courtesy www.OptionsAnalysis.com)

The expiration black line is not affected.  However, the other three lines “shift” to the right (i.e., higher level) and we can see that a profit of say $500 could be obtained relatively soon even without a sharp risen the price of USO.

Summary

Remember, this is not a recommendation, only an example.

The trade highlighted herein qualifies as an “advanced lesson” in option trading strategy (so congratulations if you are still reading).  There is a lot to absorb and there is also a great deal of risk since this trade more or less qualifies as “trying to catch a falling safe”.  However:

When implied volatility for USO options reverses to lower ground, chances are it will happen very quickly (especially if USO advances even a little in price) and the opportunity to take advantage of the current excessively high level of implied volatility may be lost.

So for a trader looking to take advantage of the current extreme IV levels in USO options (and who is ready, willing and able to cut their loss if USO drops a certain distance below $6.89), this serves as an example of “one way to play.”

Jay Kaeppel


Is This the Greatest Buying Opportunity Ever in Crude Oil?

Please note the question mark at the end of the title.  I am legitimately just asking the question and not attempting to imply that it is true.  This question I based on what was written by Douglas Terry of Alhambra Partners in this article – which I suggest you read in its entirety.

(See also Jay’s Trading Maxim’s (Part 1) and Jay’s Trading Maxim’s (Part 2))

(See also One Way to Play Crude Oil Volatility)

The gist of what is contained in Terry article is captured in the chart below which is a screen shot from that article.  Figure 1 display the price of gold divided by the price of a barrel of West Texas intermediate Crude.  The implication is that relative to gold, crude oil hasn’t been this cheap at any time in the last 124 years.  This chart was originally generated by Deutsche Bank and goes back to 1865 (Man, would I love to get my hands on their database). 1Figure 1 – Barrels of WTIC that can be purchased with an ounce of gold (1865-present); Source: Deutsche Bank

As I wrote about here and here, one can argue that we are seeing a “blood in the streets” type of scenario playing out in the energy sector.  “So far, not so good” since those articles were written as the energy sector continued to fall very hard in early February.  Still, it seems like a good time to invoke:

Jay’s Trading Maxim #292: There is a difference between picking a bottom and recognizing a  potential opportunity.

Crude oil and the rest of the energy sector have been in a virtual free fall for some time now.  How long that fall will last and when it will end is unknowable.  But also remember:

Jay’s Trading Maxim #293: Most truly great buying opportunities do not look anything at all like truly great buying opportunities at the time they are truly great buying opportunities.  In fact, they typically look like just the opposite.

Bottom line: I have no idea when the energy sector will bottom out – and yes, it could be at significantly lower levels.  Still, I do think we may look back at this time period as a buying opportunity.  So pay close attention.

Jay Kaeppel

A Blowoff Buying Panic in GLD and TLT?

I normally try to offer up opinions with some sort of quantified backing.  But as with all things there are exceptions to every rule.  As the stock markets teeters on the edge of the precipice, other action looks a bit “suspicious” to me.

Specifically:

*The action in both gold and long-term Treasury bond looks to me (yes, this is an entirely subjective, gut level reaction based on nothing but similar scenarios that my market-addled brain seems to recall in the past) like “blow off” panic buying.

This type of action is typically not sustained.

(See also Jay’s Trading Maxim’s (Part 1))

Figures 1 and 2 display the intraday action for tickers GLD (an ETF that tracks gold) and TLT (an ETF that tracks the long t-bond)1Figure 1 – Ticker GLD (Courtesy: www.FreeStockCharts.com)

2Figure 2 – Ticker TLT (Courtesy: www.FreeStockCharts.com)

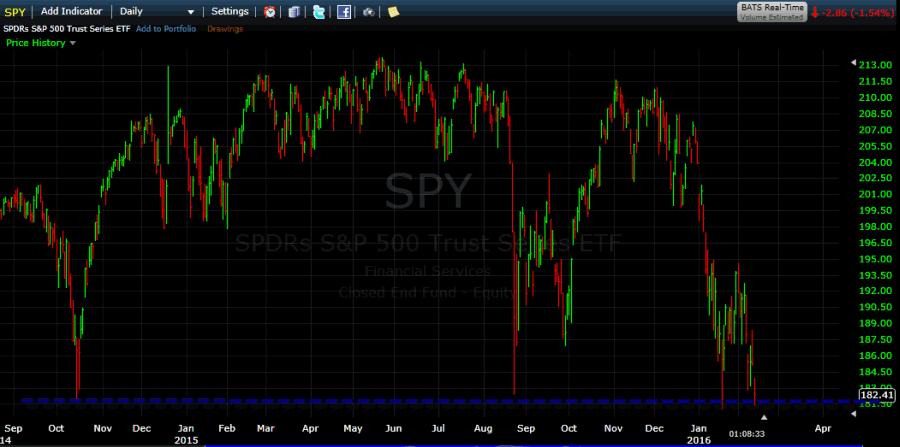
If the stock market does break down through the resistance level shown in Figure 3 then “all bets are off” and things may get a whole lot worse.  And in that case there may be more buying coming into gold and bonds.

But for what it’s worth – and despite the fact that I have been bullish on gold and bonds recently – I am not chasing GLD or TLT at this point.

3Figure 3 – Ticker SPY – on the “ledge” (Courtesy: www.FreeStockCharts.com)

Jay Kaeppel


Jay’s Trading Maxims (Part 2)

Jay’s Trading Maxim #72: The purpose of a stop-loss order is not to maximize your profitability.  As a wise (and grizzled) old trader once said, “The sole purpose of a stop-loss order is to save your sorry assets.”

Jay’s Trading Maxim #73: A great trade does not make you a genius.  An awful trade does not make you a moron (granted you could still be a moron, just not based solely on that awful trade).

(See also Jay’s Trading Maxim’s (Part 1))

In other words, being spectacularly wrong about any trade (assuming you properly manage your trade and thus do not lose your shirt) should essentially be meaningless in the long run.  Think about that for a moment.  When the average investor puts on a position he or she suddenly turns into a person in the stands at the race track, ticket in hand, rooting for his or her horse to perform well.  They experience elation when they win and disappointment when they lose.  Which leads right to:

Jay’s Trading Maxim #74: The market does not care about you or what you think or what you want.  It doesn’t care what you hold, whether you are long or short or how much you really want this one to be a winner. It’s not about you. So get over yourself.  So forget all of the mental and emotional gymnastics.  Focus on the cold, hard reality of what really matters, as clearly stated in:

Jay’s Trading Maxim #75: Investing is not so much about “right or wrong” as it is about “how much” and “how often.”

In other words, the keys are to make a lot when you win, lose only a little when you lose, or if you can’t do that, win a very high percentage of the time.  Which is nicely summarized in:

Jay’s Trading Maxim #76: Investment success or failure comes down to simply this – (# of winners divided by # losers) times (average winning trade divided by average losing trade).  The bigger this number then more money you make.  So focus your efforts on maximizing these numbers.

Jay’s Trading Maxim #77: Moving averages are most useful not as “precision timing” tools, but rather as “perspective” tools.

Jay’s Trading Maxim #78: To invest your money in a good idea is wise.  To invest your ego in any position, not so much.

Jay’s Trading Maxim #79: When it comes to momentum plays, enjoy the ride but never forget that the ride can end abruptly (so always keep an eye on the exits).

And if you find yourself entering a momentum play all the while saying, “I’ll figure out when to get out when the time comes”, please remember:

Jay’s Trading Maxim #82: Investors who “fly by the seat of their pants” so to speak, ultimately experience “backside heat discomfort”, so to speak, and spend a lot of time being unable to “sit down”, so to speak.

Jay’s Trading Maxim #101: Beware the trap door at the top of the escalator.

Or, if you prefer:

Jay’s Trading Maxim #102: What goes up runs the risk of coming down – really hard.

So the easier the ride and the more comfortable you become on the way up, the more – not less – fearful you should be of what may follow.

Jay Trading Maxim #107: Writing covered calls is like finding free money.  Except when it’s not.

Jay’s Trading Maxim #108: Traders who have a proclivity for “betting the ranch” – so to speak – invariably end up “renting a small apartment” – so to speak.

(See also A Blow off Buying Panic in GLD and TLT?)

Jay’s Trading Maxim #112: In the financial markets, too much knowledge can be a dangerous thing – especially if it is the direct result of too much thinking.

Jay Trading Maxim #113: Go ahead and pick a bottom if you feel the urge – but don’t be stupid about it and do not – I repeat DO NOT – “bet the ranch.”

Jay’s Trading Maxim #115: The greatest thing about trading options (“there are so many possibilities”) is also – ironically – the very worst thing about trading options (“there are so many possibilities”).

 Jay’s Trading Maxim #146: Circular System Logic: If you are going to follow a system precisely, make sure it’s a pretty good system.  And if your system is pretty good you should follow it precisely (HINT: It’s not as easy as it sounds).

 Jay’s Trading Maxim #176: Price above moving average – good.  Price below moving average – bad.

Which I think sums it up pretty well.

 Jay’s Trading Maxim #177: If you had to choose, in the long run you are better off with an attitude that states that “every trade is just as meaningless as every other trade” than you are thinking that every trade is going to “be the big one.”

While a very strong wind may get your boat to shore more quickly, there is also a much greater risk of an adverse event.  Given a choice, a sailor will typically prefer relatively calm seas to a full force gale.  For most of us the same is true in trading.  In a nutshell, if you approach each trade as “just another day in the office” so to speak, you reduce the tendency to become emotionally attached to a given position or market outlook.

Jay’s Trading Maxim #187: Tis a far better thing to say “I got out before I lost my shirt” than to have to say “I lost my shirt because I wanted to be proven right.”

So what’s the alternative?  As dispassionate an approach to investing as possible.

Jay Kaeppel

Jay’s Trading Maxim’s (Part 1)

Just dug these up from “Kaeppel’s Corner” articles I wrote for www.Optionetics.com for 9 years.  Turns out  there is a bunch so I am going to spread them out a bit.  Anyway:

Jay’s Trading Maxim #1: Your absolute #1 priority as a trader is to be able to come back and be a trader again tomorrow.

Sounds so obvious, doesn’t it?  But you would be surprised how many people violate this maxim.  And it’s a hideous thing when it happens.

(See also Jay’s Trading Maxim’s (Part 2) and Jay’s Trading Maxim’s (Part 3))

Jay’s Trading Maxim #2: The keys to trading and investment success are, A) utilizing a method or methods that have a realistic expectation of generating profits over the long run, and B) having the financial and emotional wherewithal to follow your method(s).

(A or B alone is not good enough.  If you have a lousy trading plan then the worst thing you can do is to actually follow it.  Likewise if you have a great trading plan but can’t quite seem to follow it, well, let’s just say that that’s not going to end well either.)

(See also One Way to Play a Spike in SPY Volatility)

Jay’s Trading Maxim #3: Basically everything that you do as a trader or investor should serve to make sure that you are adhering to 2A and 2B above.

 Jay’s Trading Maxim #4: The volatility of the fluctuations of the equity in your account will have a greater impact on your success or failure as a trader than any other factor.

Swing too little and you never quite make enough on the “ups” to offset the “downs”; swing too much and eventually (and Murphy’s Law being what it is, at exactly the wrong time) you cry “Uncle” and one day you find that you are not a trader anymore.

 Jay’s Trading Maxim #7: Rocket science is great but when it comes to investing, it’s not necessarily necessary.

 Jay Trading Maxim #9: The fact of the matter is that there are lots of trading methods that work well.  The trick is finding one that works well for you.

 Jay Trading Maxim #12: All of trading comes down to (# of winners/# of losers) times (Average winning trade / Average losing trade).  Higher values equal greater success, lower numbers….not so much.

 Jay’s Trading Maxim #14: When push comes to shove in the financial markets (and come to think of it, life in general), you alone are responsible for your own actions.  So choose wisely.

 Jay’s Trading Maxim #20: The markets don’t always do what you want them to do.

This leads us directly to:

Jay’s Trading Maxim #21: How right or wrong you are on a given idea matters not a wit.  The only thing that really matters is how much money you actually make or lose in the process.

Jay’s Trading Maxim #22: If a setup “looks too good to be true” (but might still turn out to be true anyway), consider a limited dollar risk trade using options.

Jay’s Trading Maxim #24: The danger of a winning trade is the potential for it to fill your head with visions of grandeur.

Jay’s Trading Maxim #25: The danger of an unmanaged losing trade is obvious – you can lose your shirt.  The other insidious danger of any losing trade is that it can affect your thinking and make you second guess subsequent decisions for a very long time.

Jay’s Trading Maxim #26: The day that you experience absolutely no emotion as you are stopped out of a properly managed losing trade is the day you gain the potential to become wildly successful in the markets.

Jay’s Trading Maxim #27: When it comes to trading/investing, between theory and reality there is a chasm a mile wide.

A more succinct corollary is:

Jay’s Trading Maxim #28: If you don’t consistently cover your a?# then eventually you will lose you’re a?#.

In other words, it’s good to have an idea to use as a basis or foundation for investing.  But you absolutely, positively must make the assumption that sooner or later something unexpectedly bad will happen.  And if you do not take steps to be prepared in advance to deal with that adverse event, well, please review Trading Maxim #28 above.

Jay’s Trading Maxim #29a: One of the most surefire ways to lose money in the financial markets is to trade a futures contract without a thorough understanding and appreciation of the potential risks involved.

Jay’s Trading Maxim #29b: The worst thing that can happen to any trader is that they recklessly violate JTM #29a and somehow make money on their first three futures trades anyway (i.e., once you think you’ve “Got The Touch”, you “Are Toast”).

Jay’s Trading Maxim #31: Never stick your head fully into the sand – it’s really hard to breathe.

And

Jay’s Trading Maxim #32: He who “bets the ranch” (figuratively speaking), ends up “finding another line of work in a non agricultural field” (also figuratively speaking).

Jay’s Trading Maxim #37: Recognizing the trend right now is worth far more than a thousand predictions on what will happen next.

Jay’s Trading Maxim #44: At no time are money management and risk management more imperative than when everything looks like it’s all about to come up roses.  Or to put it more succinctly, you are at your greatest risk when your defenses are down.

Jay’s Trading Maxim #50: The markets don’t always do what you want them to do.  Likewise, the markets don’t always do what you expect them to do.  If you accept these facts and plan accordingly, you may or may not trade more profitably, but you’ll definitely experience a lot less “angst.”

Jay’s Trading Maxim #71: It’s really hard to predict what’s going to happen in the stock market over the next [your time frame here].  And when I say “really hard” I mean “really, really hard”.

This maxim evolved from a recurring and disturbing pattern of events that basically went something like this:

1) One guy would predict that the market would go up over the next x-months.  And in fact it actually would.

2) Suddenly everyone – myself included – couldn’t wait to hear what this “oracle” had to say next.

3) Maybe he would get another call right, but eventually he would get it almost exactly and completely wrong – either confidently advising everyone to “buy” just before a big market drop, or shouting “SELL” right before – you guessed it – the next big rally.

4) Then everyone would scurry off to follow another advisor who had correctly “predicted” the rally that the last guy had missed.

5) So on and so forth, repeat, ad nauseum, ad infinitum.

Jay Kaeppel