Monthly Archives: January 2016

Blood in the Energy Streets

One of the oldest, coldest and cruelest adages in investing states that the time to buy is when “there is blood in the streets.”  It occurred to me today that we may be getting close to that point in the energy sector.

Don’t get me wrong, I am not making any bold proclamations here.  I am as fearful of diving into the energy sector as the next guy at the moment.  I have no idea how much further crude oil may fall and I have no way of saying for certain that the predictions of $20 or $10 a barrel will not play out. So I am in no big rush to “dive in” here.

Still…absolutely everything that I read about the energy sector is now uniformly bearish. Does this or does this not qualify as “blood in the streets?”

An Interesting “Spike”

I read www.ZeroHedge.com and suggest that you do also.  It contains a lot of information without any “sugar coating” and I find it to be a valuable source of information that I don’t find in other places.  That being said, I noticed something in a recent post that struck me in a very contrarian kind of way.  In this post the author rightly points out the frightening fact that Wells Fargo presently has $17 billion (that’s billion with a “b”) in outstanding – mostly non-investment grade – energy sector loans. The frightening implications – dire straits for the banking Industry, the threat of another 2008-type financial meltdown, etc. – are not to be ignored.

But there was also a chart included, which is captured as displayed in Figure 1 below.  It displays the U.S. High Yield Energy Bond Yield. 1aFigure 1 – U.S. High Yield Energy Bond Yield (Source: www.ZeroHedge.com)
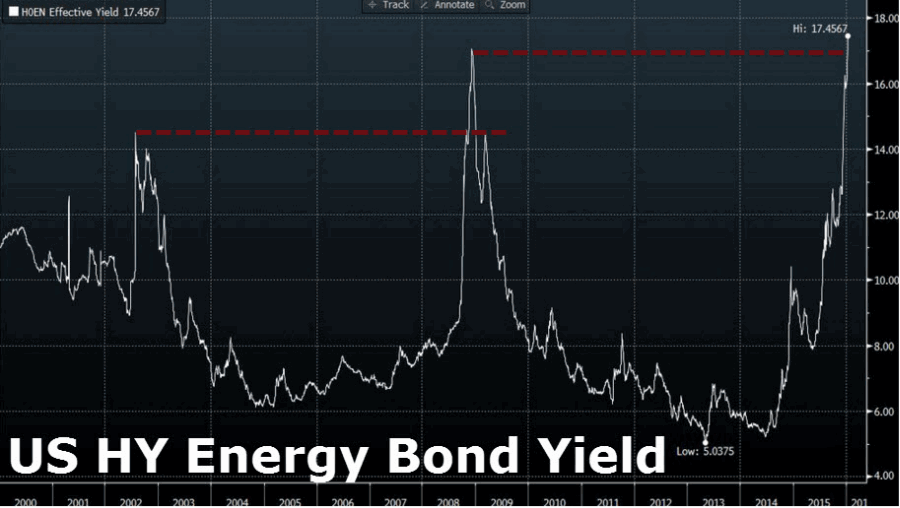
The value in the chart has spiked to a new all-time high, eclipsing the previous high from 2008, which eclipsed the previous high from 2002.  It is a fairly simple reaction to look at the chart and gasp “Whoa”.  But something popped in my head and (unlike a lot of things that pop into my head) I was right about this one.

Figure 2 displays Fidelity Select Energy (FSENX) with the dates of three spikes from Figure 1 highlighted.  Notice anything interesting?1bFigure 2 – Fidelity Select Energy(Courtesy AIQ TradingExpert)
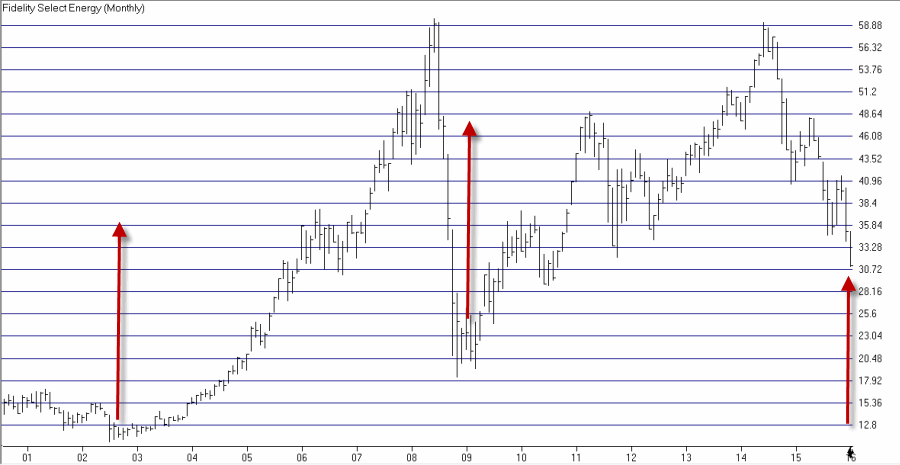
The bottom line is that the two previous spikes marked major bear market lows for energy stocks – in mid-2002 and the end of 2008. So will it play out this way again this time around?  Or are we really headed for the financial apocalypse this time around?

I do not presume to know the answer.

But I think it may be about time to start looking at the energy sector as a potential buying opportunity (although I do think it makes sense to wait for some sign of an end to the waterfall decline in the price of all things energy).

Jay Kaeppel


QQQ Bull Put Spread Example

The trade highlighted in this piece is an “example” of a bull put credit spread using options on ticker QQQ, the ETF that tracks the Nasdaq 100 Index. It t would should NOT be construed as a recommendation.  However, it does offer a classic example of a number of elements that a trader should consider when evaluating a certain type of trade.

QQQ Snapshot

As of 1/15/16:

*Implied Volatility for options on ticker QQQ is presently near the high end of the historical range (See Figure 1). This tells us that there is presently a lot of time premium built in price of QQQ options and suggests that “selling premium” might be the best approach to trading QQQ options.1Figure 1 – Implied volatility is high for QQQ options – meaning lots of time premium in the price of QQQ options(Courtesy www.OptionsAnalysis.com)

“Spikes” in implied volatility most often – though certainly not always – accompany at least short-term bottoms in price (See Figure 2).2Figure 2 – “Spikes” in IV often highlight (at least short-term) lows (Courtesy www.OptionsAnalysis.com)

*QQQ was extremely oversold and was threatening the recent low range of $98.01-$98.75 (See Figure 3).  This area may serve as a useful “line in the sand”.  If it holds – and especially given the current oversold state of the market – a sharp reversal could occur.  However, if that price range is breached to the downside it would suggest abandoning any near-term bullish hopes.3

Figure 3 – QQQ with clear support levels (Courtesy AIQ TradingExpert)

When we put all of these factors together it may seem reasonable to believe that QQQ may hold – and possibly bounce off of its recent support level, at least for a short while. So the example trade that appears in Figures 4 and 5 below attempts to take advantage of such a scenario.

QQQ Bull Put Spread

The example trade displayed in Figures 4 and 5 is referred to as a “bull put spread” as it creates a bullish position by selling an out-of-the-money put option and buying a further out of the money put option at a lower strike price.  In this example, this trade will make money as long as QQQ – presently trading at $100.84 remains above $96.52 through January 29th.

The trade involves:

*Selling 10 Jan Week 5 97 strike price puts

*Buying 10 Jan Week 5 94 strike price puts

4Figure 4 – QQQ Jan Week 5 Bull But Spread (Courtesy www.OptionsAnalysis.com)5Figure 5 – QQQ Jan Week 5 Bull Put Spread Risk Curves (Courtesy www.OptionsAnalysis.com)

As you can see in Figures 4 and 5:

*The maximum profit potential is $480

*The maximum risk is -$2,520 (which we will attempt to minimize in a moment)

*The options expire in less than two weeks on January 29th

*The downside breakeven price is $96.52

*If QQQ is above $96.52 at the close on 1/29 this trade will show a profit

*If QQQ is above $97.00 at the close on 1/29 this trade will earn the maximum profit potential of $480

So the gist of this trade is that a trader who would enter into this type of position would have to be confident that QQQ will decline no more than another -4.3% prior to 1/29. 

Stop-Loss Considerations

If a trader entered this example position, held it until expiration and at that time QQQ was below $94 a share, this position would show a loss of -$2,520.  Allowing this to happen is simply not advisable.  A trader could decide to exit the trade if price drops below the breakeven price of $96.52 – which is below the “Line(s) in the sand” displayed in Figure 3.

Getting stopped out at this price would result in a loss of approximately $620-$680, depending on how soon this price is hit.

Summary

The example QQQ trade highlighted here combines a number of elements:

*Selling premium in the face of high implied volatility

*A clear “line in the sand” (i.e., an identifiable support level)

*A decent reward-to-risk ratio (for a short premium trade)

*And a relatively short holding period (14 or less days)

*A breakeven price that is 4.3% below the current underlying market price

Does that mean it’s a good trade?  Not necessarily. The obvious risk is that it doesn’t take much to imagine QQQ cutting through the “line in the sand” and the breakeven price like a hot knife through butter.  In other words, this trade could have already been stopped out by the time you read about.

But hey, that’s the nature of trading.  The real point is not the actual trade highlighted but the underlying principles and steps used to identify the trade.  If you consistently put the odds in your favor you stand an excellent chance for long-term success.

Jay Kaeppel


An Update that is Complete JNK

As I said here I hope to offer more example option trades as a form of education.  Yesterday I highlighted examples using options on JNK and SLV.  SLV did well on Day 1, JNK did not.  So a quick update on JNK.

Ticker JNK

First a quick reminder that the trade highlighted here using put options on JNK was clearly marked “example” and not “recommendation”.  Part of the reason is highlighted in Figures 1 and 2.

One of the “rationale” for the bull put spread highlighted originally was the notion that JNK “may be in the process of forming a double bottom.”  A person could look at the chart in Figure 1 and say “OK, I could see it…maybe”.1Figure 1 – JNK Double Bottom? (Courtesy: AIQ TradingExpert)

And then comes the harsh reminder that attempting to pick bottoms is fraught with peril.  On 1/13 – and as you can see in Figure 2 – JNK plunged right through the old low into new low territory.2Figure 2 – JNK Double Bottom – NOT? (Courtesy: AIQ TradingExpert)

So Now What

Since this trade was offered as an example, the simple thing to do would be to simply say “I would never make that silly mistake” and move on.  But the purpose of education examples is – um, well, education.  And since we all make mistakes at times it can be instructive to consider the possible course(s) of action should you find yourself in a “bad scenario”.  So let’s consider where to go from here.

On 1/13/16, JNK closed at $33.06.  In the original article I suggested two potential stop-loss levels:

Stop-Loss level #1: $32.92 – almost there and highly likely to be hit.  This stop loss level will “stop the bleeding” at a reasonably small level (likely somewhere in the -$400+ range).

Stop-Loss level #2: Slightly under $32.43 – For those who can handle the emotional stress of holding onto a trade that goes south immediately – and potentially stays south – there is one interesting thing to note about the prospects for this trade.  As you can see by looking at the black line in Figure 3, this trade is still technically in the “Profit Zone”.  In other words, as long as JNK stays above $32.43 it will ultimately show a profit.3Figure 3 – JNK Bull Put Risk Curves (Courtesy www.OptionsAnalysis.com)

Summary

So what is the proper course of action here?

*Cut bait sooner than later since the original reason for the trade (i.e., a potential double bottom) appears to have evaporated?

*Hold on as long as JNK remains above the trade’s breakeven price of $32.43?

*Something else?

Here is where trading gets hard – because there is no right or wrong answer.  The keys are to make your bet decision, stick with it and to never regret or second-guess once you’ve made your decision.

Hey, this lousy example trade might be useful after all…..

Jay Kaeppel


Catching the Falling JNK Safe

Well as I said here I hope to offer more example option trades as a form of education.  So let’s look at two.  These trades both involve limited risk, yet I would still classify both of them as “high risk”.  The reason for the high risk designation is simply that they are both designed to pull off that “amazing”, yet “fraught with peril” trick of “attempting to catch a falling safe”, i.e., picking a bottom.

This piece discusses a trade using options on ticker JNK which is an ETF that trades junk bonds.  The companion piece that uses a different approach to play a similar sitution in SLV is here.

Ticker JNK

As you can see in Figure 1 below:

*Junk bonds have absolutely gotten killed of late.  Junk bonds are more highly correlated to the S&P 500 than they are to treasury bonds but they are susceptible to changes in interest rates.  When you combine a weak stock market with an uncertain to higher interest rate environment – well, it “ain’t pretty”, as you can see in Figure 1.

*There is a chance of a glimmer of a hope that JNK is about to form a double bottom at or around $33.22 a shares.  Now would I bet my retirement account on that?  Not a chance!  Would I bet “a couple of bucks?”  Maybe.  And that is what the example trade below is designed to accomplish.  In a nutshell, as long as the recent low holds, the trade makes money.  If it does not hold, it’s time to take a loss and head for the exits.

1Figure 1 – JNK with high implied volatility and a potential double bottom forming (Courtesy www.OptionsAnalysis.com)

Before showing you the specifics please note the most important thing to know about a trade like this:  It could get blown out of the water in a heartbeat.

In other words, by the time you read this it could have already been stopped out.  While the trade below is an “example” and not a “recommendation”, the key thing to remember for a trader considering this type of trade is that they MUST stand ready to act if things go the wrong way.  If you are not – or are not sure of you are or are not – then you should avoid trades like the one below.

The JNK Bull Put Spread

As you can also see in Figure 1, the implied volatility for options on ticker JNK is presently at the high end of the historical range.  This tells us that there is a lot of time premium built in to the prices for JNK options and suggests that “selling premium” may be the best approach for trading JNK options.

The example trade involves selling the March JNK 33 strike price put option and buying the March JNK 30 strike price put option as displayed in Figure 2.2Figure 2 – JNK Bull Put Spread Risk Curves (Courtesy www.OptionsAnalysis.com)

The key things to note:

*The trade involves trading a 10-lot using a limit order to enter the spread at a credit of $0.57 (selling ten 33 puts at $0.72 and buying ten 30 puts at $0.15).

*The maximum profit potential is $570 and will be achieved if JNK closes above 33 at March option expiration (although the goal is to be out before then…read on)

*The maximum risk is $2,340 which would occur if JNK was at or below $30 at March option expiration (under no circumstances would we hold his trade and allow that to happen.

Stop-Losses

A trade may consider one of two (or possibly both) approaches to cutting a loss on this trade should the recent – and admittedly, extremely tenuous – low of $33.22 in JNK fail to hold.

Method #1:

The first would be to exit this option trade if JNK drops below $33.22. For example, if we exited this trade with JNK at $32.90 a share this trade could lose somewhere between $250 and $330 depending on how quickly it is hit.

So this approach essentially approach bets heavily on the recent low of $33.22 holding with an approximate risk of -$330 and a maximum profit potential of $570.

Method #2:

A closer look at the risk curves drawn in Figure 1 (each colored line on the right hand side represents the expected profit or loss based on the price of JNK as of a particular date) reveals that the actual “breakeven (at expiration) price for this trade is $32.43.  In other words, there is in essence 3.22% of “downside protection” (the difference between the current price of $33.51 and the breakeven price of $32.43).

So a trader could alternatively decide to set a stop-loss just under $32.43 instead of at the higher level of $32.90.  If JNK fell quickly to this lower level then this trade would experience a loss of roughly $575.

The tradeoff between Method #1 and Method #2 is that Method #2 has:

*A higher potential dollar risk, but also

*A higher probability of NOT getting stopped out

Summary

This example JNK trade qualifies as rank speculation as trying to “pick a bottom” is routinely “fraught with peril.”  Still, it offers a reasonable tradeoff between potential reward and anticipated risk.  In addition, it takes advantage of current high implied volatility levels for JNK options by “selling premium.”

One other thought would be to consider waiting for an actual double bottom to form before considering a position such as this.

Jay Kaeppel


Catching the Falling SLV Safe

Well as I said here I hope to offer more example option trades as a form of education.  I wrote about an example trade using options on JNK here.  Now let’s shift our attention to ticker SLV, an ETF that racks the price of silver bullion.3

Figure 1 – SLV with low IV and potential double bottom (Courtesy www.OptionsAnalysis.com)

As you can see in Figure 1:

*SLV has taken a beating

*SLV could potentially be forming a short-term bottom (well it could)

*Implied volatility for SLV options is at the low end of the range (which suggests that buying premium may be the best course of action)

As with any trade that attempts to pick a bottom (or top), there are a thousand and one reasons NOT to take this trade (and remember that this is an “example” and not a “recommendation”

The SLV Long Call

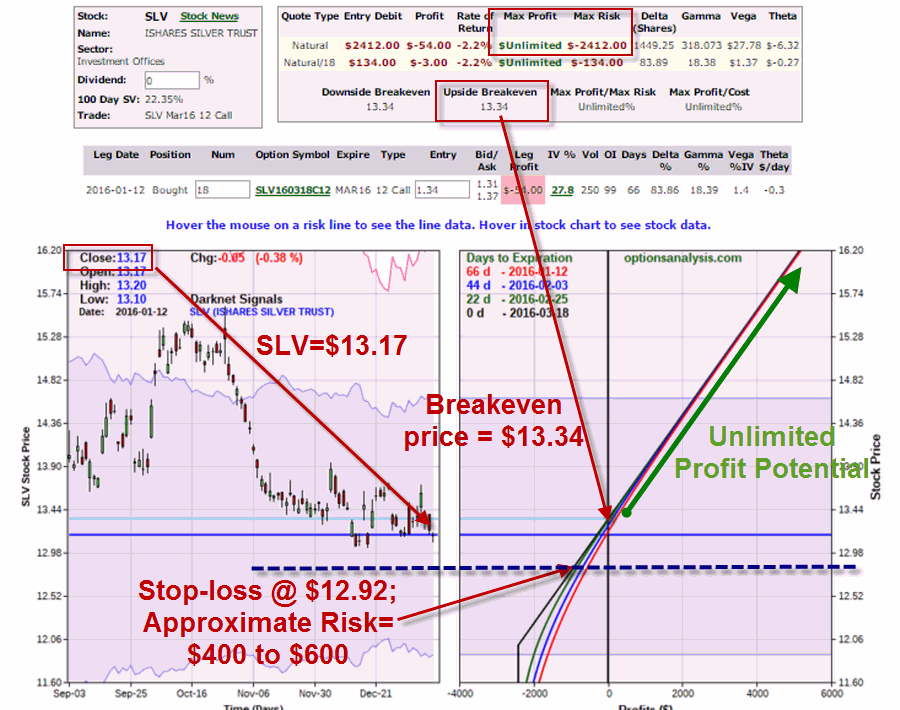
In this example we are going to enter a bullish position in SLV options – one that attempts to limit the amount of time premium paid.  The example trade involves buying the March SLV 12 strike price call option at $1.34 with SLV shares trading at $13.17.

4Figure 2 – Long Mar SLV 12 Call (Courtesy www.OptionsAnalysis.com)

The key things to note:

*The trade involves trading an 18-lot using a limit order to enter the trade at $1.34 (midpoint of the bid/ask spread).

*The cost of the trade – and the maximum risk – is $2,412.

*With SLV shares trading at $13.17, the breakeven price for this trade is just $0.17 higher at $13.34 (strike price of 12 plus option premium paid of $1.34).

*Above $13.34 this trade enjoys point-for-point movement with SLV shares and unlimited profit potential.

Stop-Losses

This trade is nothing more than rank speculation that the recent low of $13.04 for SLV shares will hold.  If that low is taken out in any meaningful way, the jig is up.

There is no “magic number” as to what constitutes a “meaningful” break.  But for your consideration, note in Figure 2 that if SLV hits $12.92 then a trader can exit this trade with a loss of somewhere between $400 and $600, depending on how soon $12.92 is hit.

Summary

This example SLV trade qualifies as rank speculation as trying to “pick a bottom” is routinely “fraught with peril.”  Still, it offers a reasonable tradeoff between potential reward and anticipated risk.  In addition, it takes advantage of current low implied volatility levels for SLV options by buying an in-the-money call option and involves paying time premium of only $0.17.

One other thought would be to consider waiting for an actual double bottom to form before considering a position such as this.

Jay Kaeppel


2016 – Year in Review

AAAHHHHHHHHHHHHH!!

OK, granted the above analysis is based on a “small sample size” and is a little short on specifics.  Still, I think it pretty well captures the overall tone of things so far in the New Year.  Stocks and commodities (with the exception of gold) have been pounded.  The U.S. dollar and bonds haven’t done much and foreign stocks and bonds – in the immortal words of whoever said it first – fugedaboudit.

*Just think, not that long ago we were debating which economy – U.S., China or India would experience the greatest growth.  Now we are wondering if we might see a “race to the bottom.”

*Not that long ago the three most valuable commodities in the world were gold, crude oil and whatever came in third (my wife would vote for coffee).  Now we are wondering if it will soon be canned food, shotgun shells and cabins in the woods……..But never mind about all that right now.

A Snapshot

For the record:

*Most – but not all – of the trend-following tools I personally follow are now bearish for U.S. stocks.  This suggests that a tremendous amount of caution is in order and that long-term investors should be thinking about how to hedge their portfolios in case the bottom does in fact drop out.

*At the same time, most of the overbought/oversold type indicators and models that I personally follow are anywhere from mildly to extremely oversold.  Which simply means that if you are considering panicking there may be a better time for that in the not too distant future.

First Five Days of January

The values in Figure 1 were compiled by Tom McClellan of McClellan Financial Publications.  It shows all of the years when the market showed a loss over the first five days of January, and how the market performed for the month and calendar year after that.1Figure 1 – S&P 500  Performance after 1st Five of January are Down (Courtesy: Tom McClellan of McClellan Financial Publications)

Interestingly the four worst January’s previously (1991, 1978, 1982, 1988) all ended up showing a gain for the full year.   On the other hand, the next three worst years (1974, 2008, 1962) witnessed some serious bear market activity.

My quick take is that a “down first five days” in and of itself has little predictive value (although if the first five days of January, the last five days of January and the month of January as a whole are all up or all down, that is a different story) that investors and traders should monitor trend-following and overbought/oversold indicators instead to guide their trading.

Jay Kaeppel

Doing More with Options

One of the things I’d like to do more of in 2016 is offer up more examples of ways to use options to trade.  It is my opinion that there is a whole world of opportunity out there that most traders and investors never explore.

To wit, via the use of options you can trade:

*Stocks

*Indexes

*ETFs

*Gold and Silver

*Crude Oil and Natural Gas

*Interest rate products

*Volatility

*Currencies

*And so on

Likewise, you can trade the bearish side of the above as easily as you might trade the bullish side, all while limiting your dollar risk.

The Catch

The problem I have in writing about options is that in order to actually illustrate what’s involved I need to write about specific trades.  When I do this I always point out that it does not amount to a “recommendation”.  Still there are always two concerns:

1) Someone will assume that it is a recommendation anyway and end up risking money on an “example”.

2) Even if an example trade is recognized as an example trade, the fact remains that if it all goes horribly wrong I run the risk of looking like an idiot because I wrote about being “bullish this” or “bearish that” at the wrong time.

The Answer

There are two avenues I may go moving forward, when it comes to offering up option trading examples:

1) I will simply ignore concerns 1 and 2 above and just emphasize each time that I am offering “examples” and not “recommendations”.

2) I may use examples from a previous date.  The upside to this is that no one will be tempted to act on the example.  The downside is that it sort of smacks of “cherry picking”, i.e., I can always show winning trades if I feel like it.

Anyway, there you have it.  Now click here for the first EXAMPLE(!!)

Jay Kaeppel

Fading Natural Gas with UNG Options

I recently wrote about the tendency for natural gas to show weakness during the following period:

*The period from the end of January Trading Day #5 through the end of February Trading Day #11 has tended to be bearish for natural gas (1/8/16 through 2/16/16)

Please note the use of the word “tendency” and the lack of the words “You”, “Can’t” or “Lose”.

I am not recommending that anyone go out and play the bearish side of natural gas. However, I am going to offer an example of one way to do just that as an educational example.

Bear Call Spread using Feb UNG Options

Ticker UNG is an ETF that tracks the price of natural gas futures.  Instead of betting that UNG “will decline”, we will instead bet that UNG “will not rise more than a certain amount.”

In Figure 1 we see that the implied volatility for options on UNG is near the high end of the historical range:

This tells us that there is a lot of time premium built into the price of UNG options and suggests that selling premium might be a better strategy than buying premium.

1Figure 1 – Ticker UNG with high implied volatility (Courtesy www.OptionsAnalysis.com)

Before we look at the specific trade example note in Figure 2 that the example trade I will highlight is essentially a bet that UNG will remain below the level indicated on the chart through February Trading Day #11 (2/16).

2Figure 2 – Ticker UNG (Courtesy: AIQ TradingExpert)

A trader who is NOT willing to make that bet should not make the trade highlighted below

Example Bear Call Spread Trade

A “Bear Call Spread” involves selling a lower strike price call option and buying a higher strike price call option.  More premium is received for the option sold than is paid out for the option bought.  As long as the price of the underlying security remains below the strike price of the option sold the trade makes money.

The example trade using options on ticker UNG highlighted below involves:

*Selling Feb UNG 10 strike price call options

*Buying Feb UNG 11 strike price call options

For arguments sake we will assume a trader is willing to commit $2,000 to the trade.  In this case the trader can trade 24 contracts of each option.  The resulting position appears in Figure 3 and 4.

3Figure 3 – Feb UNG Bear Call Spread (Courtesy www.OptionsAnalysis.com)

4Figure 4 – Feb UNG Bear Call Spread Risk Curves (Courtesy www.OptionsAnalysis.com)

As you can see in Figures 3 and 4:

*The maximum profit potential for this trade is $432, or roughly 22% in 42 days IF UNG is at or below $10 a share on 2/16.

*The breakeven price for this trade is $10.01.

*The maximum risk is -$1,968.  However, a trader should consider exiting the trade if UNG rises into the $10.03 – $10.63 range.  In the worst case of an immediate rally, a trader could limit his or her loss to -$630 to -$960.

*As this is written, UNG is trading at $9.08 a share.  This trade will show a profit as long as UNG remains below roughly $10.03 by 2/16.

Summary

Is this a good trade?  That’s not for me to answer, as this is only an example and not a recommendation.  The key points however are:

*It takes advantage of high implied volatility by selling premium

*It can make money even if UNG rises another 10%.  At the same time, given the volatile nature of natural gas prices, it should be remembered that this trade could get blown out of the water in very short order.  Therefore a trader MUST sand ready to cut  a loss if the worst case transpires.

*There is a fairly objective “Uncle” point (above recent highs above $10 a share) where a trader can say “I am wrong and am getting out.”

I don’t know if it’s a good trade….but it sure is a good example.

Jay Kaeppel

If You Already Didn’t Have Much Faith in the Fed, This Probably Won’t Help

The link below is to an article written by Gary Gordon about a CNBC interview with Robert Fischer, President of the Federal Reserve Bank of Dallas for more than a decade (2005-2015).

From the comments made it appears the Fed was not concerned with inflation, money supply, or any of the other usual suspects.  The goal was to prompt a bull market in stocks. And while I have nothing against a good bull market, two things to note:

  1. Is that really the job of the Fed?
  2. While bull markets are fun while they last, the stated goal – a “wealth effect” – doesn’t seem to have panned out too well at all – and certainly not as planned.

Cynics of the world (“Hi, my name is Jay”), enjoy..

‘We Front-Loaded An Enormous Stock Market Rally’ by Gary Gordon

Jay Kaeppel

A Reason to Hold Off Jumping Aboard the Natural Gas Bandwagon

A lot is being made of the recent and sharp upside reversal in the price of natural gas.  This is not surprising since natural gas has been in a long-term decline since roughly July of 2008.  However, in order to gain the proper perspective, note:

*The sharp upside reversal in Spot NG displayed in Figure 1 below.

*The monthly performance for Spot NG displayed in Figure 2 below.

1Figure 1 – Daily Spot Natural Gas (Courtesy: ProfitSource by HUBB)

2Figure 2 – Monthly Spot Natural Gas (Courtesy: ProfitSource by HUBB)

In the context of Figure 2, the “sharp advance” displayed in Figure 1 is not quite as impressive.

While there is nothing that says that the recent advance in NG cannot continue, it may be useful to note that historically the early part of the year is not always “kind” to natural gas.

Specifically:

*The period from the end of January Trading Day #5 through the end of February Trading Day #11 has tended to be bearish for natural gas

Figure 3 displays the growth (such as it is) of equity achieved by holding long one futures contract of natural gas during the time frame listed above since 1991.3Figure 3 – Cumulative $ +(-) holding long one NG futures contract between Jan TD 5 and Feb TD 11 (1991-2015)

Figure 4 displays the year-by-year $ gain or loss achieved by holding long one futures contract of natural gas during the time frame listed above.

4

Figure 4 – Yearly $ +(-) holding long one NG futures contract between Jan TD 5 and Feb TD 11 (1991-2015)

In a nutshell, NG has:

*Advanced 9 times (36%)

*Advanced 16 times (64%)

*Average $ gain = +$5,195

*Average $ loss = (-$8,528)

Summary

A close look at Figures 3 and 4 reveals that large gains for natural gas are certainly possible during the supposedly “bearish” Jan-Feb time period.  But the point is not to convince you that natural gas cannot advance from here nor that natural gas is sure to head lower from here.  The point here is simply to suggest that – despite the recent strength in NG – the historical odds favor allocating your capital elsewhere for a little while.

If you remain compelled to play the long side of NG here, I suggest taking a look at an option position in the ETF ticker UNG in order to limit your downside risk.

Jay Kaeppel