Gold just experienced a nice “pop” to the upside, advancing $20 an ounce on 9/24. Figure 1 – Is gold turning around?
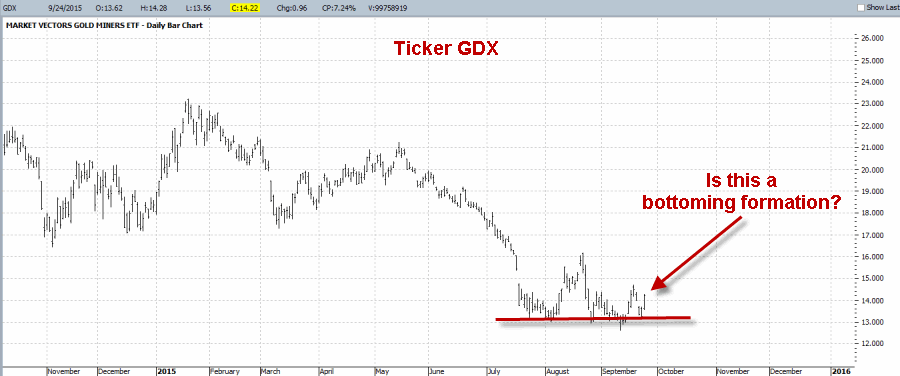
In addition, as you can see in Figure 2, it is possible to argue that gold stocks (using ETF ticker GDX as a proxy) are attempting to form some sort of a “multiple bottom”. Figure 2 – Are gold stocks forming a bottom?
Although I agree that there is much wisdom in the “never try to pick a bottom” line of reasoning, the truth is that as an option trader I have no problem with the idea of entering a limited dollar risk trade in hopes of catching a quick windfall if price reverses sharply.
So given the apparent reversal in gold bullion and the potential bottoming action in gold stocks (and the fact that I have always sort of had a “thing” for gold stocks – “Hi, my name is Jay and I am a volatility junkie”, but I digress) I am drawn to the long side of gold stocks.
But for now I am fighting the urge to act.
GDX under the Microscope – Technical
At the moment there are two concerns that are keeping me out of gold stocks – one technical and one seasonal. In Figure 3 you can see that in the software that I use for Elliott Wave analysis (ProfitSource by HUBB), the daily Elliott Wave count for GDX is still projecting lower prices. Figure 3 – Daily Elliott Wave count for GDX still pointing lower (Courtesy: ProfitSource by HUBB)
Now the truth is that Elliott Wave counts are a lot like a lot of other technical tools – i.e., there are great when they work. So I only give a certain amount of weight to any Elliott Wave projection. Also note this important distinction – in this case I am using Elliott Wave as weight of the evidence to keep me “out” of something and to avoid risking hard earned money on a speculative, counter-trend trade. That is a far different situation than if I decided to use this particular wave count to actually enter a bearish position in GDX.
GDX under the Microscope – Seasonal
Another reason I am holding off on GDX is the fact that the bulk of October has often been quite unfavorable for gold stocks. Figure 4 displays the growth of $1,000 invested in Fidelity Select Sector Gold (ticker FSAGX) only from the end of September through October Trading Day #19 every year since 1988. Figure 4 – Growth of $1,000 invested in FSAGX from end of September through October Trading Day #19 (1988-present)
For the record during this period FSAGX:
*was UP 9 times (33% of the time)
*was DOWN 18 times (67% of the time)
*average UP period = +6.1%
*average DOWN period = (-9.6%)
*Net %+(-) = -76.6%
*# times UP was > +5% = 3
*# times DOWN was < -5% = 12
The bottom line is that early October is very often NOT a great time to be playing the long side of gold stocks.
So please also note that I am not “predicting” anything here – I am simply making a trading decision (or more accurately, a decision NOT to trade) based on the best information I have.
Summary
The “speculative fool” in me is crying out to take some sort of long position in gold stocks. But the pragmatist in me looks at Figures 1 and 2 and says “there’ll be another opportunity coming along soon enough.”
That guy is just no darn fun at all.
Jay Kaeppel

