This article picks up where this article left off. Now let’s look at one example way to “prepare for the worst”.
QQQ Out-of-the-Money Directional Butterfly
Now in all candor I find that when I use phrases like “QQQ Out-of-the-Money Directional Butterfly” a fair number of people either stop reading right away or at least tart to “drift off” in terms of concentration. So for the benefit of those readers let me just say DO NOT STOP READING!!!
The only way to learn to be a better trader and investor is to consider new ideas that maybe don’t initially fit into your “comfort zone.” That does not mean that you have to accept and utilize every new idea you come across. In fact, if you already have a pretty good approach to the markets then most news ideas “should” ultimately be discarded. But closing your mind to new trading ideas is a surefire way to, er, “stunt your growth” as a trader.
So here goes:
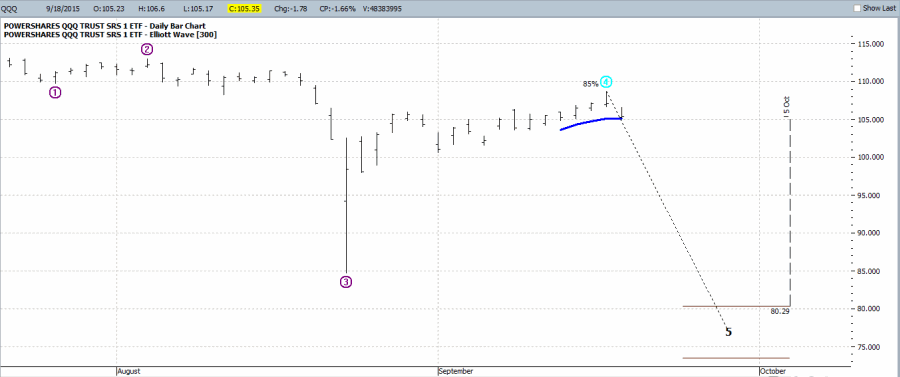
As you can see in Figure 1, the Elliott Wave count for QQQ is signaling the potential for a very sharp decline and soon.  Figure 1 – Elliott Wave count for QQQ projecting lower (Courtesy: Profitource by HUBB)
Here is something important to remember: Just because a piece of software that you use regularly “projects” something, it does not necessarily mean that it will happen.
So here are the important questions regarding the QQQ Elliott Wave projection shown in Figure 5:
Question #1) do you think there is a possibility that QQQ will sell off in the near term?
Question #2)How confident are you that it will fall as far as the projection is, well, projecting (i.e., down to the 73.50 – 80.29 price range)?
Question #3) How much are you willing to risk to hedge against whatever your downside expectations might be?
If by chance your answers to these questions are:
#1) Yes
#2) Maybe, maybe not
#3) Not a whole lot
Then the example trade below may be to interest to you. This trade involves:
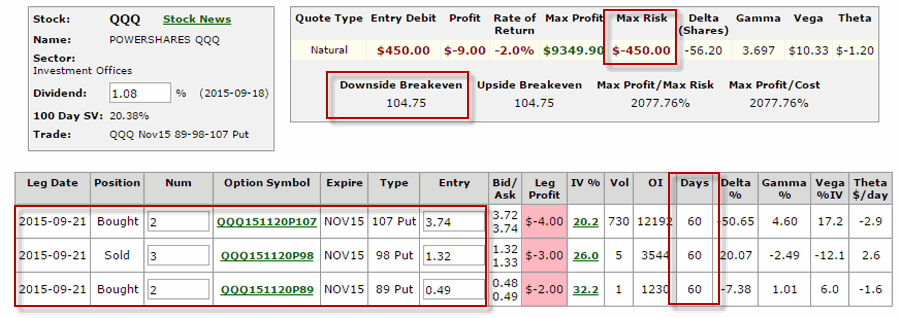
*Buying 2 QQQ November 107 puts
*Selling 3 QQQ November 98 puts
*Buying 2 QQQ November 89 puts
The cost of this trade (to buy one 2x3x2 position) is (or at least, was) $450.
 Figure 2 – QQQ OTM Put Butterfly (Courtesy www.OptionsAnalysis.com)
As you can see in Figure 2:
*The cost to enter and the maximum risk on this trade is $450
*There are 60 days left until November expiration
*The breakeven price is 104.75 for QQQ (trading at 106.50 as this is written)
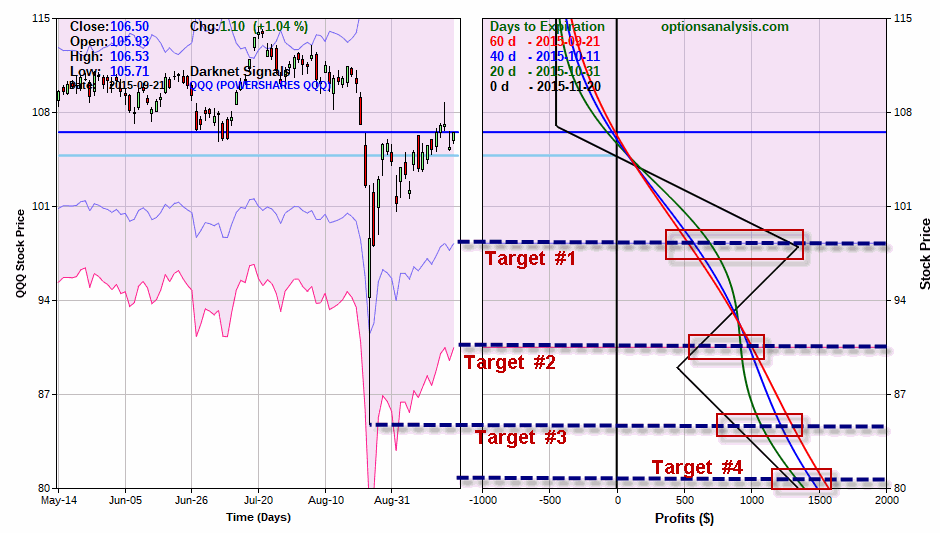
Figure 3 displays the risk curves for this trade. It also lists four potential price targets as follows:
Target #1: A one standard deviation price decline
Target #2: A 2 standard deviation price decline
Target #3: A retest of the recent low
Target #4: The upper boundary of the Elliott Wave price range projection shown in Figure 1 ($80.29)
Each colored line in the clip on the right hand side of Figure 3 represents the expected $ profit or loss ($ values listed at bottom of right hand clip) for this trade based on:
A) a given price for QQQ (listed on the left-side axis)
B) a given date (dates listed in upper left hand corner of right clip in Figure 3 under “Day to Expiration”)
 Figure 3 – QQQ Risk curves and potentia price targets (Courtesy www.OptionsAnalysis.com)
As you can see in Figure 3:
*The worst case scenario for this trade is that you hold it until November option expiration, QQQ is above 107 and the trade loses 100% (100% in this case = $450)
*You can see the profit potential for the trade at each target level in Figure 3.
Summary
As always, this is NOT a “recommendation”, only an “example”. The key points to take away are these:
*The stock market “may” be setting up for a retest (or worse) of recent lows (of course then again, it may not)
*If a trader fears that this is a strong possibility, the trade highlighted here sees as an example of one way to “risk a little” in order to “hedge a lot”.
Jay Kaeppel

