If you had to pick one stock that gets more attention than any other I think most people would name Apple (ticker AAPL). As such a widely recognized company its stock represents a major holding in many, many investment portfolios. As a result of its “leadership” position it can be important to pay attention to the action of its stock.
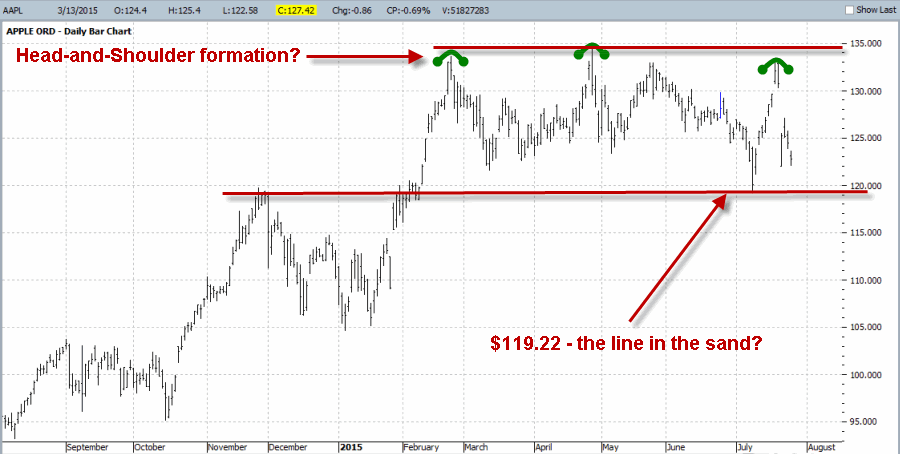
The latest action in AAPL might give us some pause. After a long advance form $55 a share in June of 2013 to $134 and change in May of 2015, it can be argued that the chart has formed a head-and-shoulders formation. For the record, I would guess that some technicians would argue that the formation does not exactly fit the classic head-and-shoulders pattern. But the primary point is that the stock has taken a couple of shots at breaking out to the upside and has been unable to do so.  Figure 1 – AAPL at the crossroads
The stock hit a high in late February then fell back and then rallied to a slightly higher high in early May. In late May and again last week AAPL trie to rally up to the early May high but failed to break through. Does this mean that this is the “end of the line” for AAPL? Hardly. But it does draw a potential resistance area. In other words, unless and until AAPL breaks out above $134.54 the bull run is in hibernation.
The lowest low recording during the formaiton of the purported head-and-shoulders pattern was $119.22. So that represent our support “line in the sand”. According to classic head-and-shoulder theory:
*If AAPL takes out the lowest low achieved while the H and S pattern was forming;
*Then the downside target is equal to the broken support level ($119.22) minus the difference between the high and low within the H and S pattern ($134.54-$119.22 = $15.32), or $103.90 ($119.22 – $15.32).
So keep a close high AAPL. Whether it breaks $134.54 to the upside or $119.22 to the downside could provide an important clue as to what is next for the stock and the overall market.
Jay Kaeppel

