I usually like to do my own research and report on that. But I am not above ripping off, er, I mean “highlighting interesting work” from other analysts.
See also Jay Kaeppel Named Portfolio Manager for New Investment Program
A case in point is the chart in Figure 1 below which was created by Kimble Charting Solutions. The chart displays the price action for the Gold Bugs Index (ticker HUI) and highlights those (rare) trading days when HUI declined by -10% or more.
 Figure 1 – Gold Bugs Index 1-day declines of -10% or more (Source: Kimble Charting Solutions)
There were four periods when this happened:
1999 – There was a brief spike a few months later, but overall the “buy signal” generated here was quite “early” as gold tock prices subsequently fell quite sharply into late 2000 before finally bottoming out.
2002 – The first -10% day was also a little early in terms of “picking a bottom” but clearly worked out fine for a long-term investor. The second -10% reading occurred in July 2002, by my figuring about three days before “the bottom”. Note however that it did take a matter of several years for prices to work significantly higher. So remember this is more of a “perspective” indicator and not a “short-term” but signal.
2008: Buying in at the first, second or even third “circle” shown during 2008 would have been the equivalent of “catching a falling safe” as price continued to plummet to the eventual low. Nevertheless, from a long-term perspective even these “too early” signals were followed by significant percentage price gains over the next several years and the “circles” that occurred near the 2008 bottom were followed by multi-year gains of several hundred percent.
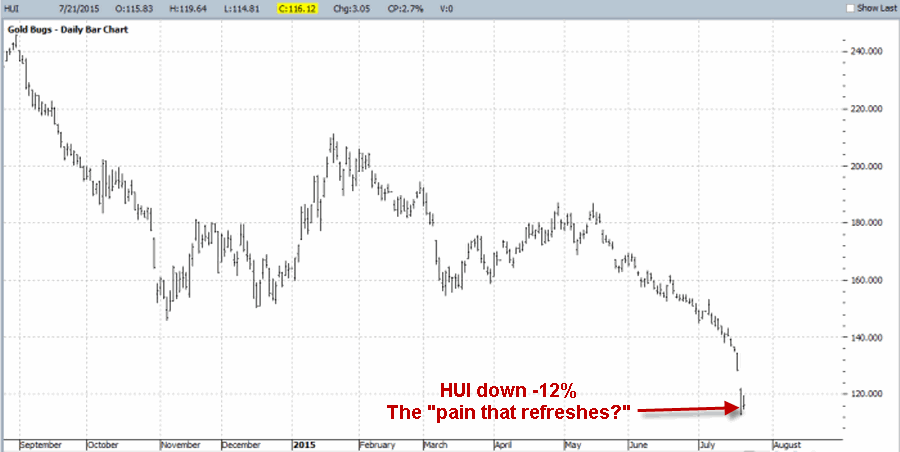
2015: As you can see in Figure 2, on 7/21/15 ticker HUI lost over -10% in single day. Thus a new oversold “circle” is drawn at the far right hand side of Figure 1 above. Figure 2 – Ticker HUI declines -12% in one day (Source: ProfitSource by HUBB)
Summary
So is it time to buy gold stocks? Well that is the question isn’t it? If the history of this particular indicator is any guide:
A) There is a good chance that it is a little “early” to start piling heavily into gold stocks.
B) We are beginning to witness “capitulation” as investors dump gold stocks.
C) We should not be surprised to see gold stocks trading significantly higher over the next several years.
Investors willing to adopt a longer-term perspective (I think there a still a few of them who haven’t yet died of old age out there) might consider one of two strategies:
1) Begin accumulating shares of gold stocks (maybe using ETF ticker GDX or Fidelity FSAGX) with the understanding that things could get a whole lot worse before they get better.
2) Wait for gold stocks to bottom out and turn higher using some sort of trend-following method (a simple moving average?) to identify when the overall trend has finally reversed to the upside. Then buy gold stocks with the anticipation that the follow through to the upside will be significant.
Of course, there is always Option 3), i.e., do nothing. Which is clearly the “low risk, low reward” approach when it comes to gold stocks.
Jay Kaeppel

