In RSI Everything (Part 1) I detailed two indicators respectively dubbed “RSIAll” and “RSIROC”. These two indicators make up half of a combined indicator I refer to as “RSI Everything”.
In Part 2 I will detail the last 2 RSI based indicators and then add them together to create one – OK, for lack of a better phrase – “Mega” RSI indicator. Traders may consider each of the four indicators separately, or combine them into one indicator as I do a little later in this piece.
Measure #3. RSIq2
I am not exactly how I came to name this one RSIq2, but for better or for worst there you have it. The initial calculations for this RSI variation are very similar to those for RSIROC detailed in Part 1. The primary difference is that this indicator uses a traditional 14-day RSI day window, and it adds an additional calculation to the mix at the end. The AIQ code for the RSIq indicator appears below followed by the gist of it in English.
ThreeDayROCRSI14 is (RSI14-valresult(RSI14,3)).
RSIPlusROCRSI14 is (RSI14-50)+ThreeDayROCRSI14.
RSIROC14 is (expavg(RSIPlusROCRSI14, 2)).
RSI14mid50 is RSI14-50.
RSIq2 is (RSIROC14+RSI14mid50)*2.
In some semblance of English:
Line 1 subtracts the 14-day RSI value of 3 days ago from today’s 14-day RSI value (to essentially factor the trend of the 14-day RSI into the mix).
Line 2 subtracts 50 points from today’s 14-day RSI and then adds in the value calculated in line 1. (this creates an indicator that fluctuates above and below zero rather than using 50 as the midpoint as with the traditional RSI).
Line 3 creates a two-day exponential moving average of values calculated each day in Line 2 (i.e., yesterday’s RSIROC14 value is multiplied by 0.6667 and today’s RSIROC14 value is multiplied by 0.3333 and the two values are added together to create today’s RSIROC14 value.
Line 4 once again subtracts 50 from today’s 14-day RSI value.
Line 5 simply adds together the values calculated in Lines 3 and 4 and then multiplies the sum by 2 to arrive at the RSIq2 value.
An example of RSIq2 plotted again an actual security appears in Figure 1. Figure 1 – Ticker SPY with RSIq2 indicator (Courtesy: AIQ TradingExpert)
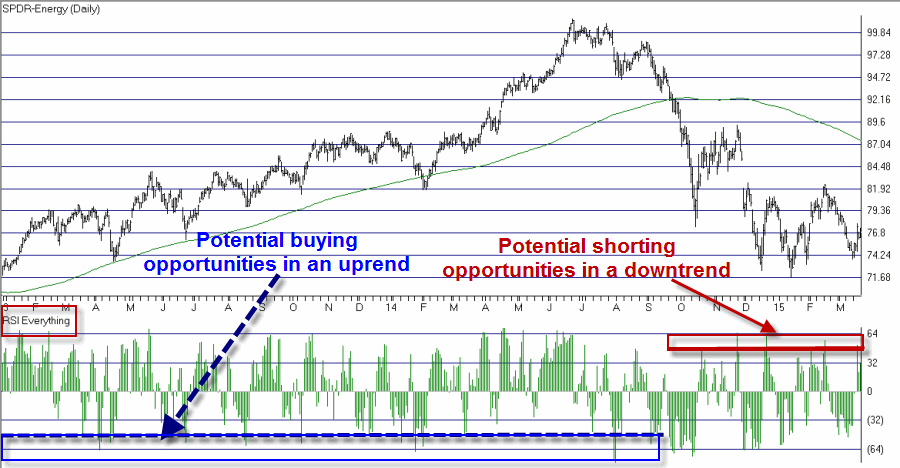
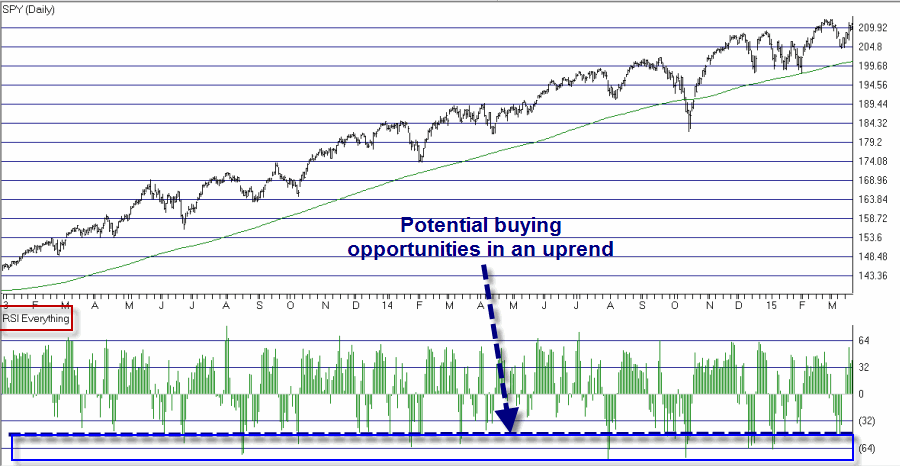
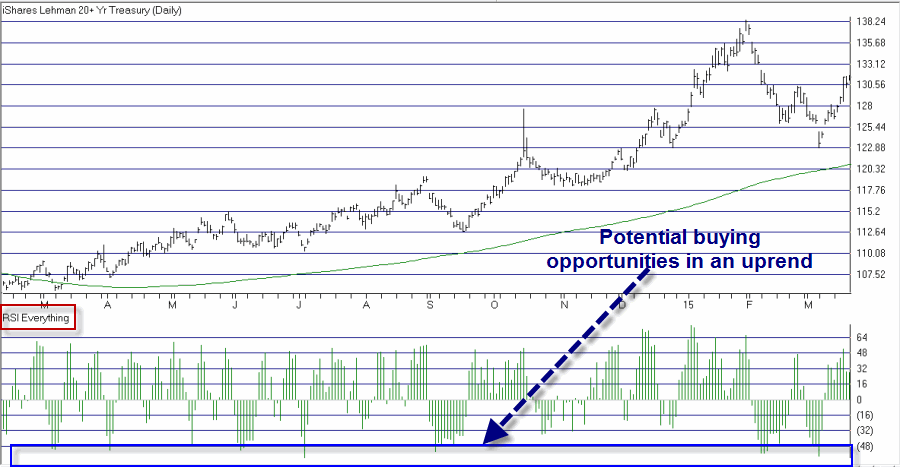
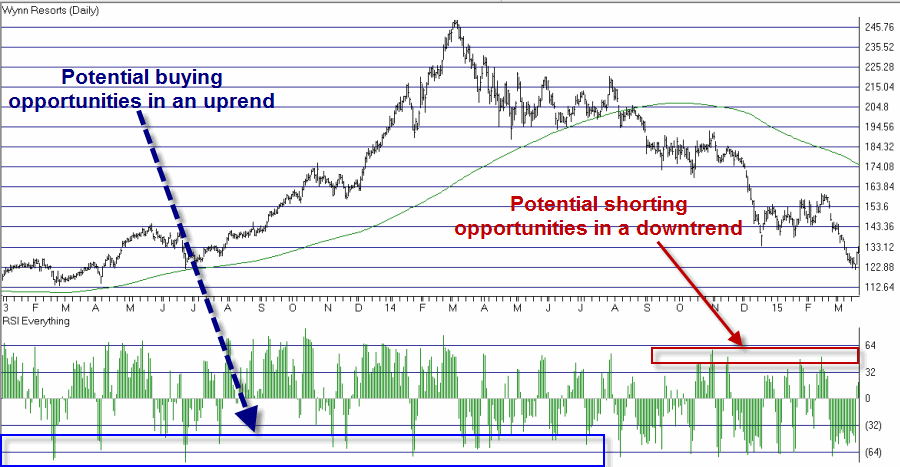
In general, readings below -64 in an uptrend signal a potentially oversold situation and readings above 64 in a downtrend signal a potentially overbought situation. But as with all of these indicators, traders are encouraged to experiment with different “cutoff” values and also with various entry triggers.
Measure #4. Tom DeMark’s Range Expansion Index (TDREI)
Tom Demark is a well known analyst and system and indicator developer. One limitation of the RSI indicator is that if price moves up or down the RSI will fluctuate even if price movement is not very meaningful. DeMark’s REI is an attempt to reduce the influence of price movements that are little more than “noise”. Rather than just noting the change in price from close to close each day, REI compares the high or low of certain days to the high or lower of certain other previous days to update the indicator value each day. The AIQ code for TDREI is as follows:
Hitoday is [high].
H2 is val([high], 2).
H5 is val([high], 5).
H6 is val([high], 6).
Lotoday is [low].
L2x is val([low], 2).
L5 is val([low], 5).
L6 is val([low], 6).
Closetoday is [close].
C7 is val([close], 7).
C8 is val([close], 8).
TD1 is [high] – h2.
TD2 is [low] – l2x.
TD3 is iff(([high] >= l5 or [high] >= l6) and ([low] <= h5 or [low] <= h6), 1, 0).
TD4 is iff((h2 >= c7 or h2 >= c8) and (l2x <=c7 or l2x <=c8), 1, 0).
TD6 is td1 + td2.
TD5 is iff((td3 + td4) >=1, td6, 0).
TD7 is abs(td1) + abs(td2).
TDREI is ((td5 + valresult(td5, 1) + valresult(td5, 2) + valresult(td5, 3) + valresult(td5, 4)) / (td7 + valresult(td7, 1) + valresult(td7, 2) +valresult(td7, 3) + valresult(td7, 4))) * 100.
I am not going to attempt to explain the REI calculations. If you want to know the particulars please follow this link: www.Google.com. Then type in DeMark Range Expansion Index.
Figure 2 displays ticker XLF with the REI indicator plotted below. Figure 2 – Ticker XLE with DeMark’s REI indicator (Courtesy: AIQ Trading Expert)
As with the previous indicators I’ve discussed the general idea is about the same – i.e., negative readings within an uptrend signal potential buying opportunities, positive readings within a downtrend signal potential shorting opportunities.
RSI Everything
So we have now detailed four different (albeit similar) RSI based indicators. Typically the next question many traders will ask is “which one is the best to use for trading?” And in fact some traders may have better success focusing on one of the four indicators rather than combining them as we are about to do next. But the reality is that each indicator gives its fair share of excellent trading signals and its fair share of just plain wrong trading signals. So for the purposes of this exercise instead of trying to “choose” we will instead “combine.”
The indicator I call RSIEverything is calculated simply by summing the daily value for each of the following indicators and dividing by four:
*RSIAll-50
*RSIROC
*RSIq
*REI
The first two were detailed here and the second two are detailed above.
Figures 3 through 6 display RSIEverything plotted against a handful of various securities.  Figure 3 – Ticker XLE with RSI Everything (Courtesy AIQ TradingExpert)
 Figure 4 – Ticker SPY with RSI Everything (Courtesy AIQ TradingExpert)
 Figure 5 – Ticker TLT with RSI Everything (Courtesy AIQ TradingExpert)
 Figure 6 – Ticker WYNN with RSI Everything (Courtesy AIQ TradingExpert)
Summary
As with any oscillator the bad news is that there is no one magic cutoff value that – once reached – guarantees that a price reversal is imminent. Still, much money can be made by “buying the pullback in an advance’ and/or shorting the rally in a decline.
Looking for a buying opportunity when:
1) Price is above the 200-day moving average and;
2) RSI Everything is below ??? -32? -48? -64?
Appears to make sense. So does looking for a shorting opportunity when:
1) Price is below the 200-day moving average and;
2) RSI Everyting is above +32? +48? +64?
The key questions for a trader to answer are “what indicator cutoff values to use to signal an opportunity” and “enter immediately or wait for a reversal or a breakout above the latest high (or the latest 2-day high”? etc.
Which reminds me to mention:
Jay’s Trading Maxim #65: Getting an indicator to signal “buy” or “sell” is the easy part. In the long run, how and when you actually enter into a new trade and how you manage that trade once entered is what separates the winners from the losers.
Jay Kaeppel


Jay,
Can you please clarify something in the RSIq2 calculation? You say “Line 5 simply adds together the values calculated in Lines 3 and 4 and then multiplies the sum by 2 to arrive at the RSIq2 value.” However, what you write in line 5 actually looks like you are adding those things that were calculated in lines 2 and 4, not 3 and 4. Can you clarify, please?
Thx.
Bruce, that’s a heck of a good catch. Thanks! I will update the article on the blog. For the record, the correction is noted below.
What it said was:
ThreeDayROCRSI14 is (RSI14-valresult(RSI14,3)).
RSIPlusROCRSI14 is (RSI14-50)+ThreeDayROCRSI14.
RSIROC14 is (expavg(RSIPlusROCRSI14, 2)).
RSI14mid50 is RSI14-50.
RSIq is (RSIPlusROC14+RSI14mid50). !<<<
Jay,
I have two specific follow-up questions on RSIq2 and then one big-picture question.
1. In your verbiage regarding the weights on the 2-period EMA (line 3 of RSIq2) it looks like the weights are flip-flopped. I may have that wrong, but that is the way it appears to me.
2. I constructed RSIq2 for the Nasdaq 100 index. There are times when I get values greater than positive 100 and times when I get values less than negative 100. Have you found that? It doesn’t appear that you have given the graph you show of AAPL, so I think I have made a mistake somewhere but I can’t figure out where. If you have found values outside of -100 to +100 then it is probable that I have done my calculations correctly.
3. My big picture question is that three of your measures have distributions of values that include negative numbers, while RSIALL can only have positive numbers ranging from 0 to 100. Did you give thought to adjusting that indicator so it too could have negative values?
I promise I am not stalking you, lol. I find I really get into doing studies like these at this time of year. Anything beats working on taxes.
As always, thanks.
Bruce,
1. Line 3 of RSIq2 calculation reads “RSIROC14 is (expavg(RSIPlusROCRSI14, 2)).” This is AIQ code and simply states that RSIROC14 is equal to the 2 period exponential moving average of indicator RSIPlusROCRSI14. Different software may use different formats, but that is the basic intention.
2. Yes RSIq2 can go above 100 and below -100. The original indicator (RSIq) is NOT multiplied by 2 and will (likely) never exceed +-100. But in order to give this indicator a little impact on RSI Everything I decided to multiply it by 2.
3. In the final calculation RSIAll has 50 subtracted from it to put it in line with the others (i.e., 0 as the neutral point).
RSIEverything is ((RSIAll-50) +RSIROC+RSIq2+TDREI)/4.
Hope that helps, Jay
Perfect! Thanks.