A long time ago a friend of mine worked for a professional sports franchise. However, as low man on the totem pole he didn’t make a lot of money. So to supplement things he got a job at a small local television station as the Producer for a show that featured local bowling on Sunday mornings. No, seriously. And he wasn’t the only guy trying to “make it.” The guy who was hired as the actual on air broadcaster had aspirations too. So he would routinely treat each frame as something akin to the ninth inning of the seventh game of the World Series. As a result he sometimes went a little overboard on the hyperbole. To wit: One day when the “local legend” – a woman who had won every local bowling title and award that was ever created – stepped up to the line with her ball in hand, the broadcaster intoned for all (roughly 12) viewers to hear, “Anything that you can do with a bowling ball, this woman has done!”
My poor friend almost peed his pants.
Anyway, the only reason I bring this up is that as a still non-recovering “numbers geek” (“Hi, my name is Jay”), I sometimes feel like “anything you can do with a couple of numbers, I’ve done it.” One case in point is the simple RSI (Relative Strength Index) indicator. Created by Welles Wilder I’m guessing 40 some odd years ago, this simple oscillator has helped to trigger roughly a bazillion trades. But some of us are not content to leave well enough alone. And so for better or worse we torture the darn thing until it is “different” (and hopefully – though not necessarily – better, for “better” is in the eye of the beholder). So (True Confession Time) I have an indicator I follow that I’ve called RSI Everything (for reasons that will become painfully obvious very soon), which combines four, um, variations, on the venerable RSI. i will cover the first two in this article .
There are many ways to calculate these things but in this article I will be including code from AIQ Expert Design Studio. Not much in the way of “rocket science” so the indicators can be easily adapted by those of you using one of the roughly twelve bazillion other charting packages available these days.
Measure #1. RSIAll
Figure 1 displays ticker AAPL with the 2-day, 3-day and 4-day RSI indicators drawn below the bar chart with the values for each appear in the lower right hand corner.  Figure 1 – AAPL with 2-day, 3-day and 4-day RSI indicators (Courtesy: AIQ TradingExpert)
In a nutshell, the 2-day is more sensitive than the 3-day and the 3-day is more sensitive than the 4-day. Most traders pick their “favorite” day window and stick with it. Nothing wrong with that. But RSIAll is calculated simply by taking the latest value for the 2-day, 3-day and 4-day RSI and dividing by three. This appears in Figure 2. Figure 2 – AAPL with RSIAll indicator (Courtesy: AIQ TradingExpert)
In a nutshell, low RSIAll readings within an uptrend are considered “bullish”, while high RSIAll reading within a downtrend are considered “bearish.” Of course, the trick is defining how low is “low” and how high is “high”. As with most indicators there are no “magic numbers.” That being said, 15 on the oversold side and 85 on the overbought side are probably a good place to start.
The AIQ Code for RSIAll is as follows:
Define days2 3.
U2 is [close]-val([close],1).
D2 is val([close],1)-[close].
AvgU2 is ExpAvg(iff(U2>0,U2,0),days2).
AvgD2 is ExpAvg(iff(D2>=0,D2,0),days2).
RSI2 is 100-(100/(1+(AvgU2/AvgD2))).
Define days3 5.
U3 is [close]-val([close],1).
D3 is val([close],1)-[close].
AvgU3 is ExpAvg(iff(U3>0,U3,0),days3).
AvgD3 is ExpAvg(iff(D3>=0,D3,0),days3).
RSI3 is 100-(100/(1+(AvgU3/AvgD3))).
Define days4 7.
U4 is [close]-val([close],1).
D4 is val([close],1)-[close].
AvgU4 is ExpAvg(iff(U4>0,U4,0),days4).
AvgD4 is ExpAvg(iff(D4>=0,D4,0),days4).
RSI4 is 100-(100/(1+(AvgU4/AvgD4))).
RSIAll is (RSI2+RSI3+RSI4)/3.
Measure #2. RSIROC
OK, for the record RSIROC is an abbreviation of another indicator I concocted with an even more arcane name titled RSIROCExpAve. The code (and a relatively weak attempt at an explanation in English) follows below:
ThreeDayROCRSI is (RSI3-valresult(RSI3,3)).
RSIPlusROCRSI is (RSI3-50)+ThreeDayROCRSI.
RSIROC is (expavg(RSIPlusROCRSI, 2)).
So what is that all about? This indicator basically builds in the 3-change in the RSI indicator itself to measure the momentum of RSI. OK, here goes:
Line 1 subtracts the 3-day RSI value from 3 days ago from today’s 3-day RSI value.
Line 2 subtracts 50 points from today’s 3-day RSI and then adds in the value calculated above.
Line 3 creates a two-day exponential moving average of values calculated each day in Line 2 (i.e., yesterday’s RSIROC value is multiplied by 0.6667 and today’s RSIPlusROCRSI value is multiplied by 0.3333 and the two values are added together to create today’s RSIROC value.
Example:
-Yesterday’s RSIROC value was 45
-Today’s 3-day RSI is 30
-3-day value three days go was 60 then:
ThreeDayROCRSI = (30-60) or -30
RSIPlusROCRSI is (30-50) + (-30) = -50
RSIROCExpAve is ((45 * 0.6667) + (-50 * 0.3333) = 13.33
Ticker GOOG with the RSIROC indicator plotted appears in Figure 3.  Figure 3 – Ticker GOOG with indicator RSIROC (Courtesy: AIQ TradingExpert)
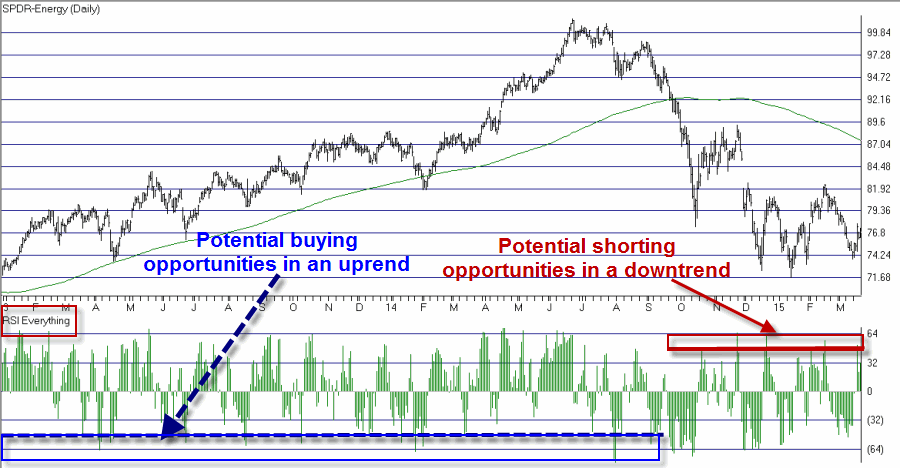
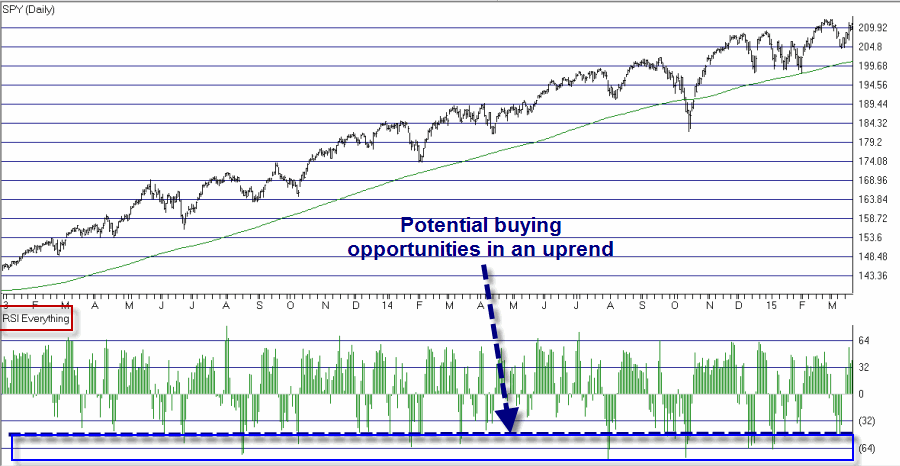
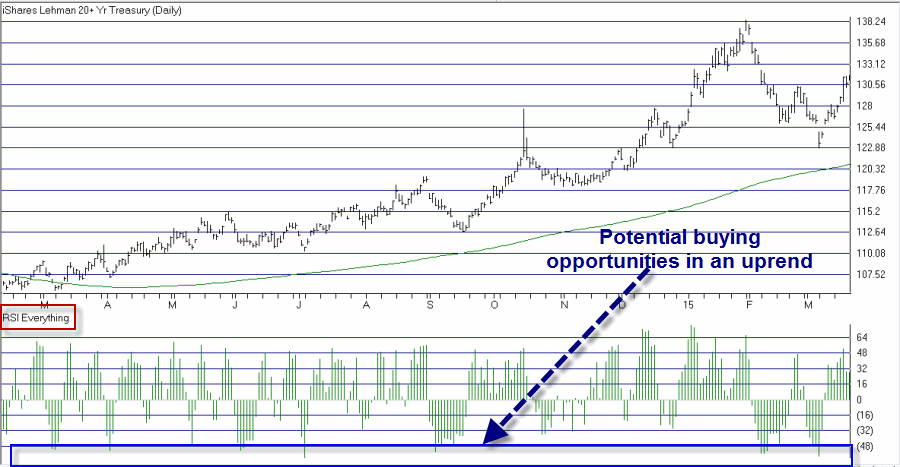
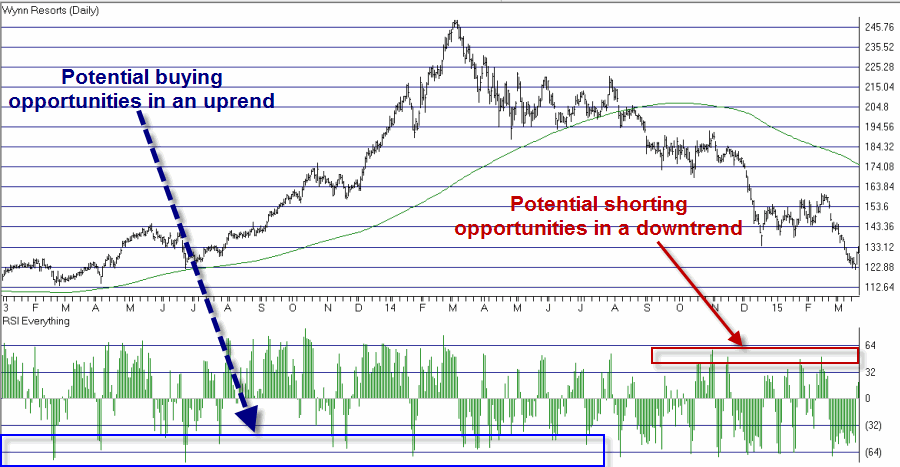
In a nutshell, the higher above 0 the RSIROC reading the more overbought the security in question, and the lower below 0 the RSIROC reading the more oversold the security in question. Readings of +60 or more and -60 or less seem like reasonable areas of “extreme” readings. The most likely use for this indicator is to look for low readings when price is above the 200-day moving average (as a potential buying opportunity) and for high trading when price is below the 200-day moving average (as a potential shorting opportunity).
n RSI Everything Part 2 I will detail the other two parts of the indicator and how the pieces go together.
In the meantime, don’t try anything crazy with a bowling ball.
Jay Kaeppel


