Monthly Archives: February 2015

The MVCI (Whatever That Means) Indicator

Some people tell me that I have “too much time on my hands” because I spend so much time “crunching numbers.”  I tell them “That’s ridiculous, I don’t have any time on my hands because I am so busy crunching numbers” (That usually shuts them up.  At least for a little while).

In any event it is true that I am something of an “indicator junkie.”  And it is also true that sometimes I multiply two numbers together (or divide two numbers) just “because I can.”  And every once in awhile something potentially valuable seems to surface (see Applying VIX(like) Indicators to Stocks).

But in the most recent case I am hoping that someone can help me here.  In the not too distant past I came across an indicator referred to by the acronym of MVCI – or at least that’s what I recorded it as.  I just can’t remember where I read about it.  In fact I don’t even recall what MVCI stands for.

But I like what I’ve seen of it so far.

The MVCI Indicator Calculations

OK, what follows is a list of a fairly lengthy set of calculations.  If you are not a “numbers geek” you might consider skipping down to the actual results.

A = Daily High

B = Daily Low

C  = Daily Close

D = 200-day moving average of daily closing prices

E = Daily True High (Today’s high or yesterday’s low, whichever is greater)

F = Daily True Low (Today’s low or yesterday’s high, whichever is lower)

G = Daily True Range (E-F)

H = Average Daily Price (A + B) / 2

I  = 15-day Average of H

J = 15-day Average of G

K = MVCI = (C-I) / (J * Square Root of 2))

L = Buy Signal Cutoff Value

M = # days to hold a long position

Figure 1 displays an Excel spreadsheet with these calculations.

1 Figure 1 – Excel spreadsheet for MVCI (whatever that means) Indicator

Hmmm, maybe I do have too much time on my hands.  But I digress.  In (slightly long-winded) English, the indicator is calculated by:

1) Subtracting the 15-day average of the average daily price (defined as( [high]+[low]/2)) from today’s closing price, and dividing that result by;

2) The 15-day average of the Average True Range times the square root of 2

Don’t ask me how someone came up with multiplying something by the square root of 2 because, well, heck I don’t even know what MVCI stands for, so how would I know?

The default value for variable L is -0.51.  The default value for M is 22 days.

A “Buy Signal” occurs when:

1) The closing price for SPY is above its 200-day simple moving average AND;

2) The MVCI value for that day is -0.51 or less.  So when a buy signal occurs the trader buys SPY and holds it for 22 trading days.

If MVCI drops below -0.51 during these 22 days then the 22 day holding period starts again at 22, i.e., positions can be held for longer than 22 days.

Figure 2 displays the fluctuations of the MVCI since 12/31/2012 with the -0.51 level highlighted in red. 2Figure 2 – The MVCI (whatever that means) indicator in action

So in a nutshell, anytime SPY is above its 200-day moving average each day the MVCI is below -0.51 starts a 22 day holding period.

Crazy , right?

Well, maybe we should consider the results first.

The Results

OK, so SPY started trading in 1997, to get a 200-daymoving average we can start testing in June of 1998.  If we start with $1,000 and invest in SPY for 22 trading days following any day where MVCI drops to -0.51 or below, we get the equity curve that appears in Figure 3.  No interest is earned while out of the market and buying and holding SPY is also plotted in red.3Figure 3 – Growth of $1,000 using MVCI (blue) versus Buying and Holding SPY (red); 1998-2015

For the record:

-$1,000 invested in SPY using MVCI in the manner described here grew to $4,417 (+342%)

-$1,000 invested in SPY on a buy-and-hold basis grew to $1,848 (+84.8%)

Maybe not so crazy, right?

Summary

For the record, please note that I do not actually use this indicator at the moment in any of my trading, nor am I recommending that you start using it either.  I have this rule – well, OK in the immortal words of Bill  Murray “it’s more like a guideline” – that I don’t use indicators when I don’t even know what they’re freaking called.

But the purpose of this blog is not to offer “advice” or to tell you what to do.  Its purpose is simply to educate you and give you some things to think about that you might not otherwise.

Like for instance, “What the heck does MVCI mean?”

Jay Kaeppel

Let’s Keep This Cornfidential

A short while back I wrote about the seasonal tendency for soybeans to advance in price between early February and mid-June.  Well I hate to anger the commodity gods by something stupid like “So far, so good” but, well, oops, I just did.  As you can see in Figure 1, well, so far so good (now I’ve gone and done it).

0Figure 1 – Soybean futures

Well as it turns out – and probably to no one’s surprise, soybeans are not the only grain to show seasonal tendencies.  The corn market has a seasonal bias that is very similar to soybeans.

Who Knew that the Planting Cycle Could be So Interesting (and Useful)?

Before going any further it makes sense to ask the question “But why would there be a seasonal bias in the beans and corn?”  The answer involves a mix of the “planting schedule” and “human psychoses” (in this case more commonly known as “uncertainty”). In the U.S. the majority of corn and beans get planted in the early spring, grow during the summer and are harvested in fall.

What this means is that after harvest and until the next planting season there are no seeds in the ground until the following spring, i.e., there is uncertainty.  So during “off season” we grain traders talk a lot about the weather.  It’s not that we’re not good at making normal conversation, er, well never mind about that.  In any event, talking about the weather – and whether or not planting conditions will be favorable or unfavorable during the following spring is something we find very interesting (which is kind of sad come to think of it, but I digress).  But the bottom line is that when there are no seeds in the ground there clearly is uncertainty regarding the next season’s crop because during this particular period of time, well, there isn’t one to speak of.

When planting season rolls around farmers start to plant and grain market analysts can go out and check the condition of the fields (hey it beats sitting around talking about the weather some more) and make some educated estimates as to whether this year will yield a “bumper crop”, a “bummer crop” or something in between.  If things look really great grain prices may not perform all that well during the spring.  But again, because there is nothing actually growing and/or blooming there is uncertainty.  And if there are any signs of trouble at all grain prices can – and at times do – rise substantially during spring as the seeds go into the ground, take hold and begin to grow.

By summer time the plants are growing the grains are blossoming and driving through the State of Illinois with its endless rows of grain fields is almost unbearable (trust me on this one).  At this point the grain analysts can go back out into the fields (do these guys know how to have a great time or what?) and make an extremely well educated (Hey, Ag is too a Major!) estimate regarding the outlook for the current crop.  As you can probably guess by now, if things look bleak (drought, floods, etc.) grain prices can continue to rise.  But by summer time most of the “fear” buying has usually already been done.  So if things look OK, the “fear premium” tends to come out of grain prices and the prices for corn and beans can show some serious weakness.

And so it goes the next year and the next year and the year after that.

So What about Corn?

The incredibly helpful graph in Figure 2 displays the monthly gain for corn futures by month since December 1979.1 Figure 2 – Corn all Months (1979-2014)

OK, not exactly helpful when presented all on one chart.  So let’s break it down a little.  Figure 3 displays corn performance only during months October through April.2 Figure 3 – Corn October through April (1979-2014)

OK, still a whole lot of “squiggliness” going on.  So in Figure 4 let’s combine all of the lines that appear in Figure 3.3 Figure 4 – Corn October through April (1979-2014)

The chart in Figure 4 illustrates exactly what I wrote about above.  While the chart is far from an unbroken advance, the long-term trend is unmistakable. “Uncertainty” in the corn market typically occurs between the end of September and the end of the following April.

What About the Rest of the Year?   

I was hoping you would ask.  In Figure 5 you see the performance for corn futures during all months that do not include October through April.4 Figure 5 – Corn May through September

Anyone notice a trend? Once “uncertainty” is alleviated the “air (tends) to come out of the balloon.”

Alternatives

The implication of this article seems to be that we should all buy corn futures on September 30th, hold until the last day of the following April and then sell short and hold a short position until the end of September.  And here lies the paradox:  On paper this strategy would have performed very well over the past 35 years.  Unfortunately, it is also a strategy that is fraught with peril.  Holding a long or short position in any futures contract “no matter what” is a dangerous game to play.  Likewise – and I cannot emphasize this enough – these tendencies DO NOT work every year “like clockwork”.  Every once in awhile corn will fall hard during the October through April period and every once in awhile corn will spike sharply higher during the May through September period (Sorry, I don’t make the rules).

Still, there does seem to be “something” to the overall seasonal tendencies, so one approach to consider is to look for “buying opportunities” (using your own preferred trading methodology) between October and April and to look for shorting opportunities between May and September.

One alternative to corn futures is the Tecrium Corn Fund ETF (ticker CORN).  Using this ETF traders can buy and sell and sell short corn just as they would shares of stock.  Two words of warning:

1) Trading volume is fairly light so traders need to carefully assess the risks associated with trading in any serious size and/or selling short.

2) Buying and holding and/or selling short and holding for months on end is a risky strategy.

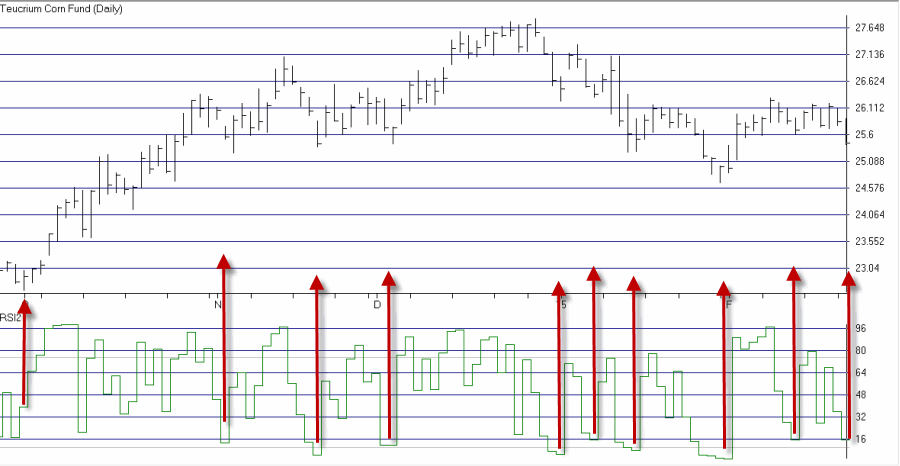
Again I would suggest using the seasonal tendency as a filter and look for opportunities to trade shorter-term in the direction of the dominant seasonal trend. For example, in Figure 6 you see ticker CORN when the 2-day RSI drops to about 16 from the end of September to the present. 5Figure 6 – Ticker CORN with 2-day RSI (Courtesy: AIQ TradingExpert)

Summary

I will be the first to (OK, grudgingly) admit that some seasonal trends don’t seem to have a lot of rhyme or reason to them.  But that is not the case with corn and soybeans.  It only makes sense that traders would generally be most anxious during the “off season” when seeds are either not in the ground or just getting planted or trying to grow.  And it makes sense that once “the news” is “out” (i.e., once it becomes clear how this season’s crop is likely to turn out) that traders would be less anxious.  As we saw in the charts, these tendencies are often (did I mention “BUT NOT ALWAYS!”) reflected with higher grain prices fall through spring and lower grain prices summer into fall.

And the beauty of this cycle with grains is that as long as the earth keeps turning the planting and growing seasons are not going to change anytime soon.

Jay Kaeppel

A Simple (Advanced) Lesson in Option Hedging

I know you’re busy.  So in everyone’s best interest I will state right at the outset that if you do not now – and if you are pretty sure you never will in the future – hedge your stock portfolio with stock index or stock ETF options, you can probably go ahead and stop reading right here.

But I do appreciate you stopping by, and in the immortal words of Jed Clampett, “Ya all come back now, ya hear?”

All right, now that that is out of the way, let’s talk about hedging with options without trying to “make it understandable” to people who not know nor care about options.

A Word of Warning to First Time Hedgers

Most people’s first foray into hedging involves something of a “Hey, I’ll think I’ll give this a shot” mentality.  Nothing wrong with that really.  The problem is that too many investors and traders are unprepared mentally for the “Lose/Lose” nature of hedging.  What I mean by that is this:

If you spend money to hedge against say a decline in the stock market, typically one of two things will happen:

1) The stock market goes up instead of down and the money you spent to hedge will be lost.

2) The stock market goes down.  Your hedge may cover all of your losses, but my experience has been that in most cases it will only offset a portion of your portfolio loss.  So while you may feel good about the fact that you’ve reduced your loss of equity, in the end you still lost equity.

So you have to be prepared for these possibilities.

Two Questions to ask before Hedging

1) What is it that I am attempting to hedge against?

2) How do I get the most “bang” for my hedging “buck?”

The best way to illustrate this is with an example.  For the record the example I am about to show is not a “recommendation”, only an example.  Although also for the record, if the stock market does turn down tomorrow and revisit the low of its recent trading range I will probably try claim that I “called the top with uncanny accuracy.”  Sorry, it’s just my nature.

Hedging with SPY

In Figure 1 we see a bar chart for ticker SPY.  1 Figure 1 – SPY trying to break out to the upside (Courtesty: AIQ TradingExpert)

One could argue that it is struggling to break out to the upside and that if it fails to do so then a trip back down to the low of the recent trading range is a good possibility.  You may buy that scenario or not, but the point is simply to ask the question, “is there a way to hedge against such a decline?”

Would I ask the question if I though the answer was “No?”

The low of the recent range for SPY was 197.86, so we will look for a way to hedge a move back down to that price level.  That is our answer to Question #1 above.  Now let’s look at some potential answers to Question#2.

Figures 2 illustrates one possible idea which involves simply buying the April 197 SPY put for $173.  We will look at the risk graph for this trade in a moment after we find something to compare it to. 2Figure 2 – Buying 1 SPY April 197 put (Courtesy: www.OptionsAnalysis.com)

A “simple advanced” alternative to this position would be to buy an “Out-of-the-money butterfly” as illustrated in Figure 3. This involves:

*Buying 2 April 197 puts

*Selling 4 April 180 puts

Buying 2 April 163 puts 3Figure 3 – Buy 2 SPY April 197-180-163 put butterflies (Courtesy: www.OptionsAnalysis.com)

So why bother with all of this?  Well, it goes back to the two questions I told you to ask earlier.  In this case we are looking for a way to hedge a move by SPY back down to about 197.80.  We also want to get the most bang for our buck.  Let’s look at why the trade in Figure 3 is a better choice than the trade in Figure 2.

Comparisons

In Figure 4 we see the risk graph for buying 1 April 197 put and in Figure 5 we see the risk graph for buying 2 April 197-180-163 butterfly spreads.4 Figure 4 – Risk Graph for 1 April 197 put (Courtesy: www.OptionsAnalysis.com)5Figure 5 – Risk Graph for 2 April 197-180-163 butterfly spreads (Courtesy: www.OptionsAnalysis.com)

Two key things to note:

1) The cost of both trades is about the same ($180 for the butterfly and $173 for the straight put option)

2) The butterfly spread offers more “bang for the buck.”

A close look at Figure 4 reveals that the put option will see its profit potential greatly diminished as time goes by due to time decay.  If SPY hit 197.80 immediately the profit would be about $380.  If it did not hit 197.80 until March 29th, the profit would be only about $120.

Now take another close look at Figure 5.  Through at least 3/29 regardless of when (and of course if) SPY falls to 197.80 the butterfly spread offers a consistent profit range of $330 to $370.

For all of you “Greeks Geeks” out there (“Hi, my name is Jay”), the key difference between these positions is seen by looking at the “Theta” values in Figures 2 and 3.  Theta is the option greek that tells you how much a particular position will gain or loss based solely on time decay.  The straight 197 put trade has a theta of -$3.87.  This simply tells us that if price and volatility remain unchanged today, this trade will still lose $3.87 solely due to time decay.  Hence the reason the risk curve lines keep moving in the wrong direction as time passes.  The butterfly spread in Figure 3 has a theta of only -$1.66.  Hence the reason the risk curves for this trade do not “face into the sunset” until much closer to expiration.

Figure 6 summarizes the expected profit for both trades if SPY falls to 197.80 by a given date.

Date SPY hits 197.80 197 Put Profit 197-180-163 Profit
2/19 +$380 +$340
3/10 +$270 +$370
3/29 +$120 +$330

Figure 6 – Expected Profit from both trades based on time

The bottom line is that the butterfly spread maintains roughly the same profit potential into late March, whereas the straight put position will see some of its profit potential vanish with each passing day due to time decay.

Summary

So is this a “great trade”?  Well, I think that one is clearly in the eye of the beholder.  In any event, just like a hedge can only serve a limited purpose, so to with this article.  I for one cannot predict if SPY will break out to the upside or reverse back down.  But I am not really trying to make any predictions here.  The sole purpose of this article is to illustrate:

1) The fact that there are ways to use options to hedge positions

2) Using the right strategy can generate more profit potential and/or a higher probability of profit for the same – and at times, less – cost.

Jay Kaeppel

It “Bean” a Good Time of Year

In case you were not aware of it, I have a “thing” for seasonal trends.  Certain commodities are especially well known for exhibiting “seasonal” – or “cyclical”, if you prefer – trends.  I’ve talked a bit recently about crude oil and energies here and here.

Another market that fits the bill is Soybeans.  Specifically beans have a tendency to show strength between early February and mid-June.

The Test

Even more specifically we will look at soybean performance as follows:

*From the close on the 8th trading day of February through the close on the 15th trading day of June since 1978.

Technical Note: The data that I am using or this test is based on a “continuous” contract which strings together the “front month” (i.e., most heavily traded) over time.  Essentially this data base simply captures the dollar value of the daily price change for the “front month” soybean futures contract and strings them together.

Also, commodity pricing and contract values can cause one to have a headache. To wit: Soybean futures contract are priced in dollar and sense for 50,000 bushels of soybeans.  So each $0.01 (one cent) move in the price of a bean contract is worth $50.  If soybeans advance from $8.00 a bushel to $9.00 a bushel, then the value of the contract increases by $5,000 ($50 a cent x 100 cents). Is this commodity trading stuff exciting, or what?

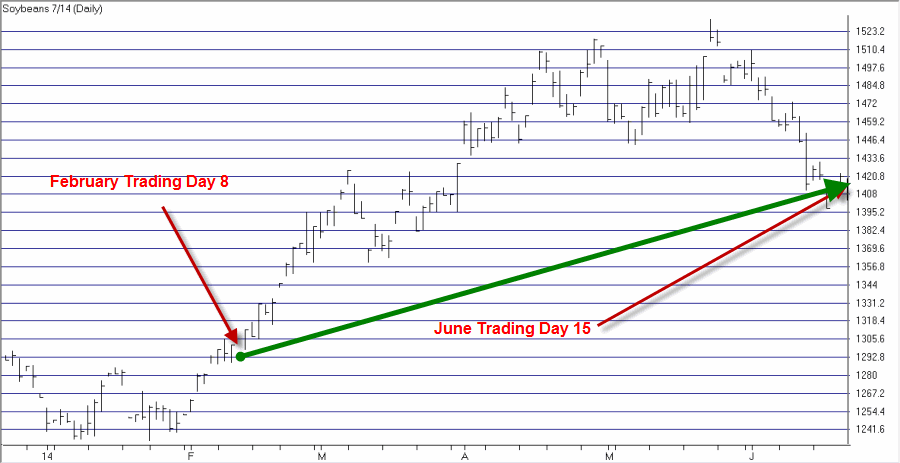
Figure 1 displays the July 2014 Soybean contract.beans Figure 1 – July 2014 Soybeans

The good news is that if a trader had bought soybeans in February 2014 and sold them in June 2014 he would have made a nice profit.  The bad news – as you can see on the far right hand side of the chart starting in around late May – is that he made a lot more money before giving a good chunk back in early July.

And this raises an important point: No one is suggesting that this be used as a mechanical approach to trading.  Well, OK, not unless you can answer “Yes” to the following three questions:

  1. Are you already ridiculously wealthy?
  2. Do you understand the meaning of the phrase “small lot size”?
  3. Do you know how to place a stop-loss order?

If you can answer “Yes” to the three questions above you are free to trade this method mechanically (although for the record I am not making a recommendation here, just highlighting an “interesting” trend).

Everybody else – well at least anyone else who is inclined to and willing to trade soybean futures – might consider the idea of looking for buying opportunities within this favorable time frame, rather than simply buying and holding.

Still, to get the idea of how useful this information might be let’s go back to our mechanical approach and consider…..

The Results

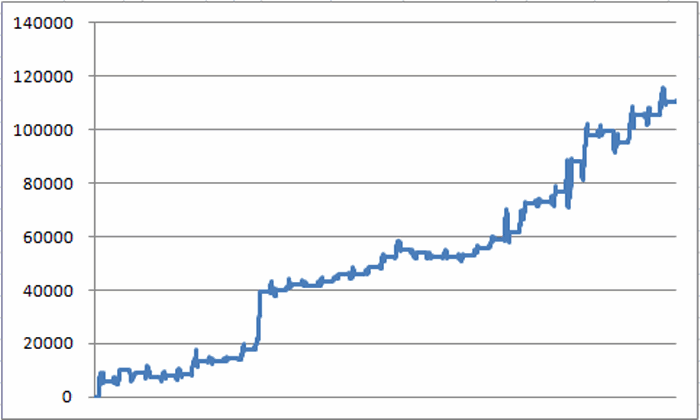
Figure 2 displays the (hypothetical) equity curve generated by holding a long position of 1 contract of soybeans during the seasonally favorable February into June period since 1978.beans1Figure 2 – Equity curve of long 1 soybean contract during seasonally favorable period

Figure 3 displays the year-by-year results.  I need to repeat here that these numbers were generated by buying March soybeans, then selling that contract in late February and buying the May contract and then selling the May contract in late April and buying the July contract (no seriously, is this commodity trading stuff exciting, or what?).

So I make no claim that these numbers are exactly what a trader would have experienced in real-time trading.  Also, there is no slippage or commissions deducted.  The purpose of this exercise is not so much to highlight the “raw dollars” but rather the fairly consistent persistence of the favorable trend within the annual time frame.

End of Period (YYMMDD) $+(-) Cumulative
0
780621 $5,813 $5,813
790621 $4,438 $10,250
800620 ($1,375) $8,875
810619 ($1,288) $7,588
820621 $119 $7,706
830621 $769 $8,475
840621 $5,150 $13,625
850621 ($63) $13,563
860620 $656 $14,219
870619 $3,600 $17,819
880621 $21,744 $39,563
890621 $306 $39,869
900621 $1,994 $41,863
910621 ($244) $41,619
920619 $1,713 $43,331
930621 $2,650 $45,981
940621 ($75) $45,906
950621 $2,469 $48,375
960621 $3,781 $52,156
970620 $3,106 $55,263
980619 ($1,350) $53,913
990621 ($1,281) $52,631
621 ($238) $52,394
10621 $463 $52,856
20621 $3,006 $55,863
30620 $3,294 $59,156
40622 $2,544 $61,700
50621 $10,919 $72,619
60621 $363 $72,981
70621 $3,856 $76,838
80620 $11,200 $88,038
90619 $10,050 $98,088
100621 $1,288 $99,375
110621 ($4,163) $95,213
120621 $10,475 $105,688
130621 ($125) $105,563
140620 $4,638 $110,200

Figure 3 – Soybeans (approximate) Year-by-Year during Feb-June seasonally favorable period (1978-2015); Includes roll overs from one contract month to another along the way

For the record, during the seasonally favorable period for soybeans:

*Up 27 times (73% of the time)

*Down 10 times (27% of the time)

*Average gain during Up years = +$4,459

*Average loss during Down years = -$1,020

*Two biggest Up years = +$21,744 (1988) and +11,200 (2008)

*Two biggest Down years = -$4,162 (2011) and -$1,375 (1980)

In a nutshell, this period has seen beans rise 2.7 times more often than they decline and the average win/loss ratio is almost 4.4-to-1.  These are values that we highly trained quantitative analyst types often refer to – using our highly technical quantitative jargon – as “pretty darn good.”

For the record the favorable period for beans in 2015 already started at the close of trading on 2/11/15.  During the first two days of this time frame March beans were up 12.75 cents (+$637.50). May beans were up 14 cents ($700) and July beans were up 14.25 cents ($712.50).

So far so good?  OK, I have to admit its a little early for that.

Summary

So should everyone be rushing to buy soybeans before the “train leaves the station.”  Surely not.  First off, let’s be honest – most people will never trade soybeans futures, nor should they. Still, as those who like to drop clichés every once in awhile to try to make themselves look smarter than they actually are (“Hi, my name is Jay”) just remember that “Knowledge is Power.”  For the record, at this point you now know more about how to make money trading soybeans than a lot of the people who currently do trade them.

One last note, although it is very thinly traded there is an ETF that tracks the price of Soybeans (ticker SOYB).  Those not inclined to trade futures contracts might take a look at buying shares of this ETF (did I mention that it is very thinly traded?)

Jay Kaeppel

26% a Year in 3 Easy Trades?

Some trading strategies make intuitive sense.  Other trading strategies do not.  With some trading strategies it is possible to articulate some logical reason or reasons regarding why they might be expected to work well over time.  With others trading strategies, well, not so much.

Some trading strategies lend some confidence to a trader.  Others offer nothing but a ridiculously good historical track record – and require a trader to make a leap of faith.

For example, consider the following seasonal trading strategy.

The Rules

*On the last trading day of January buy Energies (FSESX)

*On the 1st trading day of May sell Energies

*On the 7th trading day of August buy Biotech (FBIOX)

*On the 9th trading day of September sell Biotech

*On the 19th trading day of October buy Retail (FSRPX)

*On the 20th trading day of November sell Retail

The rest of the time the portfolio is held in cash.  For the purposes of this test we will assume that the portfolio earns interest at a rate of 1% per year while in cash.

The Results

We will start our test on 12/31/1988.  But before we look at the results of our “system” (such as it is), let’s first create something to compare it to.  So for our “comparative result” we will split $1,000 evenly between:

Fidelity Select Energy Services (FSESX)

Fidelity Select Biotechnology (FBIOX)

Fidelity Select Retailing (FSRPX)

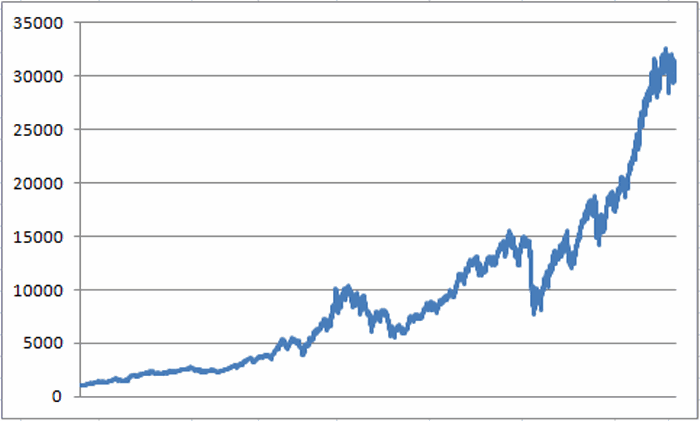
At the end of each year we will rebalance so that each year all three funds start with 1/3 of the portfolio.  The daily equity curve for this 3-fund buy-and-hold approach (with an annual rebalancing adjustment) appears in Figure 1.  jotm20150206-01Figure 1 – Growth of $1,000 in FSESX/FBIOX/FSRPX from 12/31/88 to 12/31/14 (rebalanced annually)

In a nutshell, $1,000 invested this way grew to $31,165 by the end of 2014.  This works out to about a +16.3% annual return, which in the technical financial jargon that we “highly trained quantitative analyst” types like to use, “ain’t too shabby.”  Of course a close look at Figure 1 reveals some pretty nasty swings along the way.  But hey, you “gotta take the good with the bad”, right?

Well, possibly “not.”

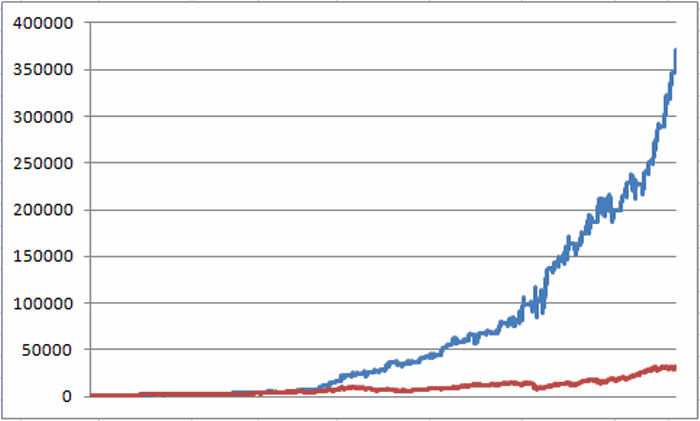
Now let’s look at the results generated following the switching rules listed earlier.  The growth of $1,000 invested using this method since the end of 1988 appears in Figure 2 (the blue line).  For comparison sake, the results we generated using the buy and hold approach is also displayed in Figure 2 (the red line). jotm20150206-02 Figure 2 – Jay’s Seasonal System (blue) versus 3 fund buy-and-hold (red); 1988-2014

Despite the fact that you may not be a “highly trained quantitative analyst” type, chances are good that even your untrained eye can pick up on the fact that there is a “discrepancy” between the blue line and the red line in Figure 2.

For the record:

-$1,000 invested using the buy-and-hold approach detailed earlier grew to $31,165, or +3,016% (+16.3% annually).

-$1,000 invested using the seasonal trading rules listed earlier grew to $347,003, or +34,600% (+26.7% annually).

In still more highly technical financial jargon, these types of 11.5-to-1 discrepancies in return are what we refer to as “statistically significant.”

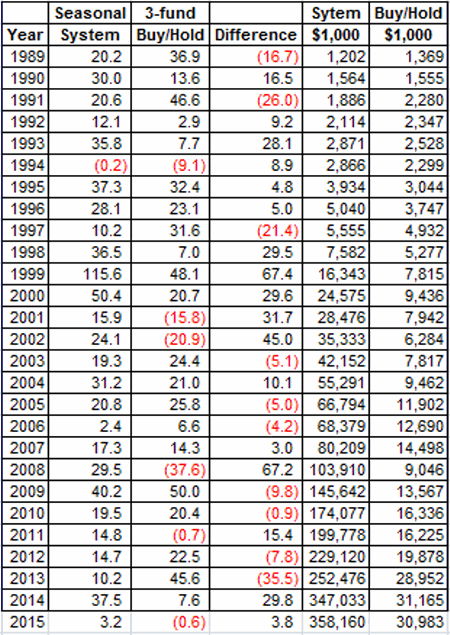
The annual results for both methods are listed in Figure 3.jotm20150206-03Figure 3 – Annual

figure 3 – Results: Jay’s Seasonal System versus Buy-and-Hold (thru 2/4/2015)

A few interesting numbers:jotm20150206-04Figure 4 – A few relevant comparative numbers

Other Choices

Fidelity sector funds are not the only choices.  Other possible candidates:

XLE           Energy Select Sector SPDR (ETF)

IBB           iShares Nasdaq Biotechnology (ETF)

XRT           SPDR S&P Retail (ETF)

OEPIX        ProFunds Oil Equipment (x1.5 leveraged)

BIPIX         ProFunds Biotechnology UltraSector (x1.5 leveraged)

CYPIX        Profunds Consumer Cyclical (x1.5 leveraged)

Summary

So should every investor simply stop what they’re doing now and just make these three trades every year and sit back and collect their 26%+ per year ad infinitum into the future?

Well it sounds good in theory, but of course the reality – as is the case with any seasonal trend – is that there is no guarantee that these trends will play out as consistently or as strongly in the future as they have in the past.

Which is where the “leap of faith” I mentioned earlier enters into the picture and leads most traders to stand on the “outside looking in.”  And maybe that is the wise thing to do.

Still, 26% is 26%.  Or to quote the immortal words of Glenn Frey: “The lure of easy money – it’s got a very strong appeal.”

 Jay Kaeppel

Is It Time to Buy Energies?

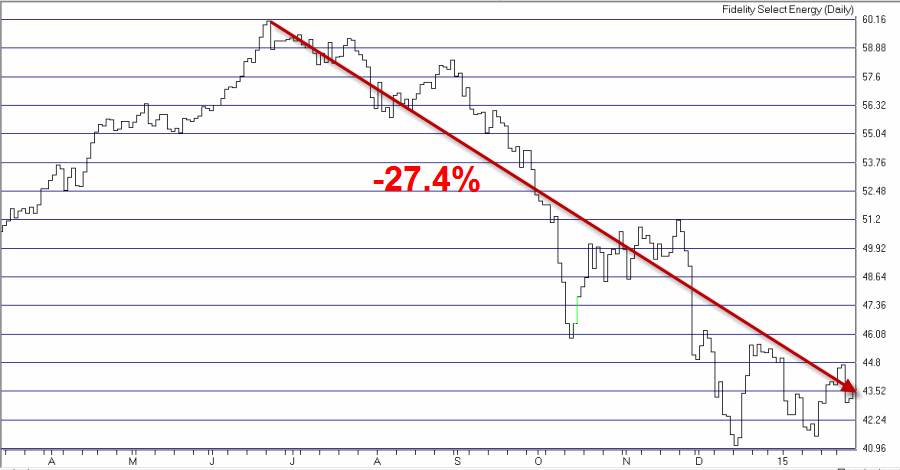
A quick glance at Figure 1 is enough to scare the daylights out of most sane investors.fsenx 1 Figure 1 – SPDR Energy (ticker XLE) (Courtesy AIQ TradingExpert)

Thanks primarily to Saudi Arabia’s desire to “boost market share” by putting a lot of oil producers around the globe “out of business”, energy prices – and the prices of most stocks in any field that has anything to do with producing energy – have plummeted since Summer 2014.

Standard investment advice suggests that it is typically a mistake to attempt to “buy the bottom.”  Still there is some evidence that suggests that this may not be the worst time to consider looking at energy related stocks.  In fact to put it more accurately, evidence exists that suggests that now may be the very best time to consider looking at energy related stocks.

The Test

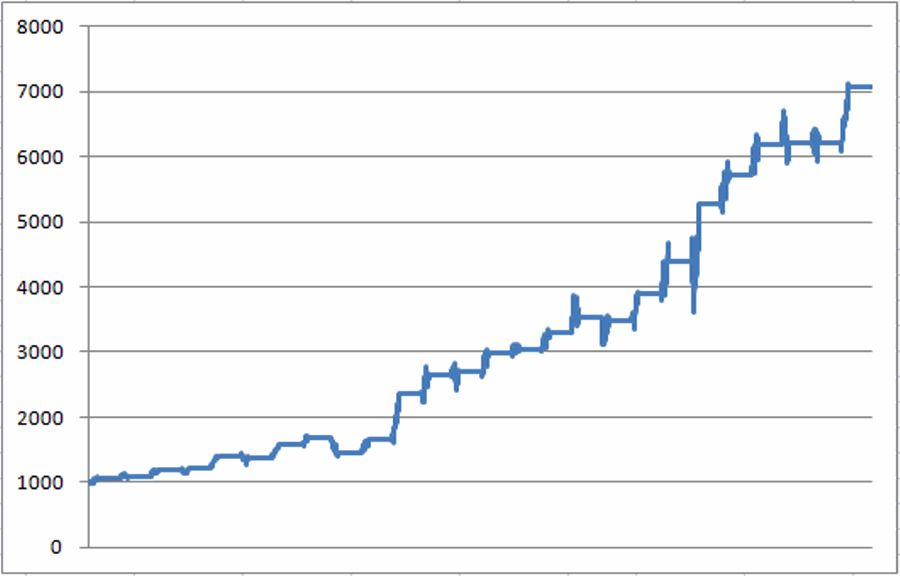
*The test below involves buying Fidelity Select Energy (ticker FSENX) on the last day of January and holding through the first day of May, each year since 1989.

*No stop-loss is involved in this test, simply buy-and-hold for roughly 3 months.

fsenx 2Figure 2 – Growth of $1,000 invested in FSENX from las trading day of January through 1st trading day of May (1989-2014)

Results

Figure 3 displays the results from each year using the “strategy” (if this can in fact be legitimately called a “strategy” – Q: Is this any way to trade energies?  A: Well, it’s one way…..).

fsenx 3

Figure 3 – Annual Results of Holding FSENX during “bullish” period

A few relevant notes:

-# times UP = 22

-#times DOWN = 4

-Annual Average %+(-) = +8.24%

-Worst Year (1997) = -13.47%

Other Choices

FSENX is obviously not the only choice these days.  Other possible candidates:

XLE           SPDR Energy

ERX           Direxion Russell 1000 Energy (x3 leveraged)

ENPIX        Profunds Energy

RYEIX        Rydex Energy

Summary

As a firm believer in the “The Trend is Your Friend” mantra, the prospect of buying energy stocks right here and now appears to be a bit “gutsy”. So the bottom line is this:

Does one put more faith in the belief that the current (down) trend will continue?  Or more faith in the seasonal historical tendency for energy stock to perform well over the next three months?

One can make a compelling argument that the worst is over for energy stocks and that a buying opportunity may be at hand.  Aggressive investors and traders should definitely be taking a look at the potential for energy stocks to bounce higher in the months ahead.  Just as importantly, anyone considering “taking the plunge” in energy stocks should be giving very careful consideration to how much capital they are willing to commit.

As always, I am not making any recommendations here, just telling you what I see.  I don’t think there is anything wrong with considering a position in energy stocks.  I do have a problem with making a huge bet in the face of an ongoing decline.  So just remember:

Jay’s Trading (and Life, for that Matter) Maxim #9:  There is an exceptionally fine line between courage and stupidity.  If you are not sure which side of the line you are on….step lightly.

Jay Kaeppel