NOTE: If you have no interest whatsoever in option trading you are free to stop reading right now. Still, if you are interested in trading strategies that can make money in unusual circumstances you might consider plowing forward for at least a few more paragraphs.
On December 16, 2014 I published an article titled “If You Just Have to Pick a Bottom in Crude Oil”. For the record, I was not necessarily advocating doing so; the real point was to highlight a little known option trading strategy known as the “Reverse Calendar spread.” The reverse calendar spread is a strategy that should only be used when implied option volatility for the security in question is extremely high, because the primary way that this trade can make money is if implied volatility subsequently falls sharply. So let’s review the hypothetical trade I highlighted and then update to see where things stand at the moment.
The Original Trade
The original trade involved the following:
*Buy 1 Feb 2015 21 Call @ 1.46
*Sell 1 Mar 2015 21 Call @ 1.77
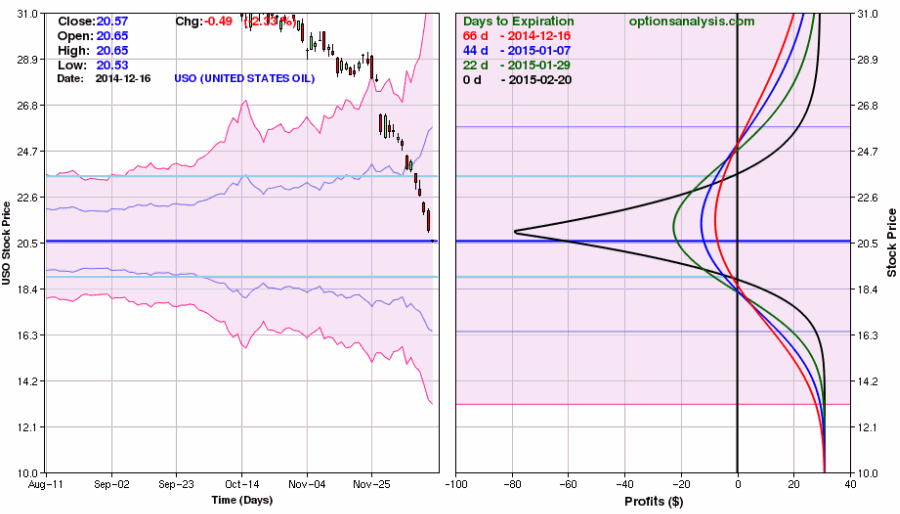
The prospects for this trade as of 12/16/14 appear in Figures 1 and 2.
Figure 1 – Reverse call calendar spread for USO (Courtesy: www.OptionsAnalysis.com)
 Figure 2 – Reverse call calendar spread for USO (Courtesy: www.OptionsAnalysis.com)
The goal was to exit the trade by 2/6/15 to eliminate the risk of experiencing the maximum loss depicted by the black risk curve line in Figure 2.
So Where are We Now?
As of 12/16/14
*USO trading at 21.30
*Feb 21 Call trading at 1.46 with implied volatility of 51.60
*Mar 21 Call trading at 1.77 with implied volatility of 42.60
As of 1/13/15
*USO trading at 17.46
*Feb 21 Call trading at 0.17 with implied volatility of 49.5
*Mar 21 Call trading at 0.37 with implied volatility of 45.9
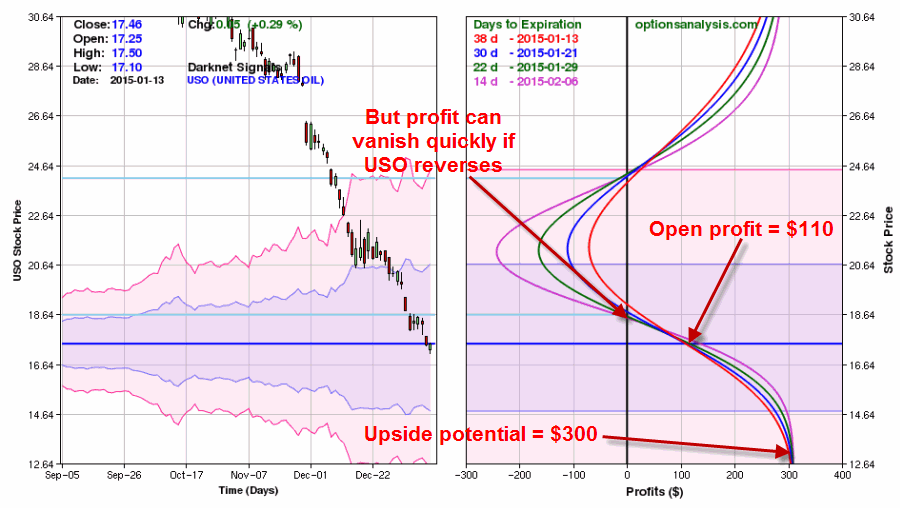
The current status of the trade (with a targeted “exit no later than” date of 2/6/15) appears in Figures 3 and 4. Figure 3 – Current status of USO Reverse Calendar spread (Courtesy: www.OptionsAnalysis.com)
 Figure 4 – Current status of USO Reverse Calendar spread (Courtesy: www.OptionsAnalysis.com)
As you can see, implied volatility has actually gone in the “wrong direction” on both legs (the Feb call we bought saw a slight decline in IV while the Feb call we sold saw a slight rise in IV).
However, during the same time USO has plummeted 18% from 21.30 to 17.46 a share and in the process pushed the trade below the lower breakeven point. With an approximate maximum risk of roughly $750 (not shown in any of the graphs and can only occur if trade is held until February option expiration on 2/20/15 – which is why we have targeted 2/6/15 as the “exit by” date), the open profit of $110 represents just less than a 15% return.
Not bad for a trade that was put on (hypothetically speaking) in anticipation of:
A) A sharp upside reversal by USO, and/or
B) A sharp decline in option implied volatility.
Despite the fact that neither of these things occurred the trade is showing a profit.
Summary
It bears repeating that this is a hypothetical trade (dang). But like I said at the outset, sometimes it’s good to know how to use certain strategies that can make money in unusual circumstances.
The reverse calendar spread certainly falls into this category.
Jay Kaeppel


