Monthly Archives: January 2015

Applying VIX(like) Indicators to Stocks

The VIX index is calculated by the CBOE using option data on SPX options (See Figure 1).  In a nutshell it measures the current implied volatility of a subset of the options traded on SPX.  If you have not the slightest idea what any of that means, fear not, for basic interpretation is fairly straightforward:

*VIX rising sharply and/or high: Traders are – or are becoming – fearful.

*VIX declining and/or low: Traders are – or are becoming – complacent.

In the cesspool of human frailties that is the financial markets (at least it’s what makes them move), “fear is good” and “complacency is bad.” At least generally speaking. vixFigure 1 – SPX vs. VIX Index (courtesy AIQ TradingExpert)
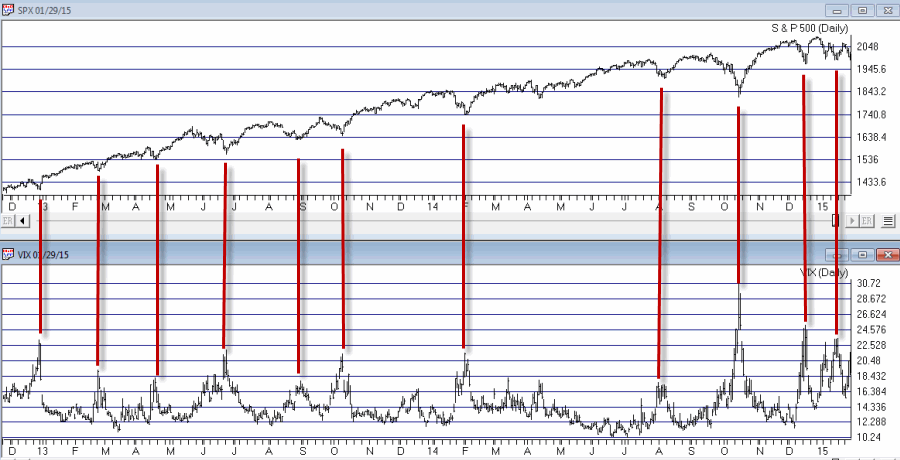
A close look at Figure 1 reveals the concept – when the market sells off, VIX “spikes” as fearful traders bid up put option prices on SPX which in turn increases the implied volatility of said options (if you want to know the inner workings please consult with my friends at Google).

In any event, one problem is that the VIX Index is designed to track investor sentiment across the broader stock market.  But is there a way to apply the VIX concept to individual stocks and ETF?

Would I ask the question if I though the answer was “No?”

The William’s VixFix Method

A number of years ago, the author of some of my favorite trading books, Larry Williams, disclosed a simple method that he had devised for emulating the VIX index for individual securities without involving complicated computer formulas or option data. And when I say “simple method” I mean “simple method.”

Highest Close=Highest closing price in most recent 22 trading day

Williams VixFix=(((Highest Close – Today’s Low)/ Highest Close)*100) + 50

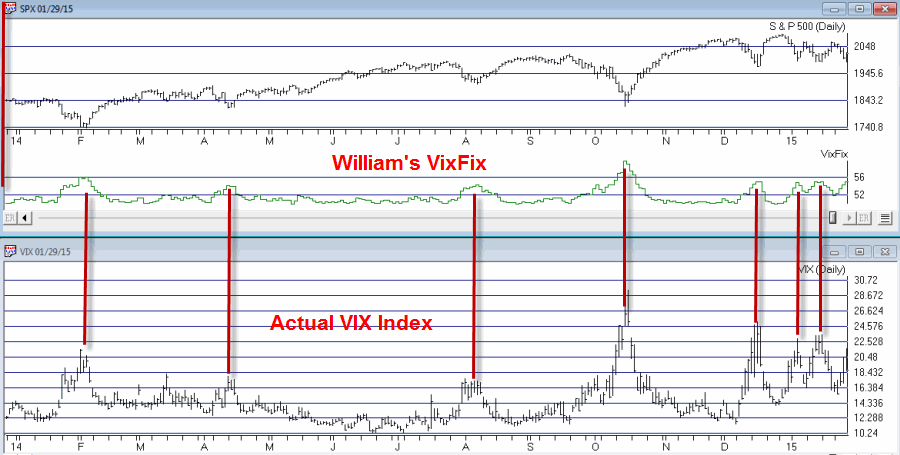
Figure 2 displays SPX in the top clip with the William’s VixFix indicator plotted just below it.  The bottom clip displays the actual VIX Index.  The key thing to note is that even though the VixFix indicator relies only on price data, it looks and acts a lot like the VIX Index itself.  So in a nutshell you have a “VIX like” indicator that can be applied to any security – with the basic premise being that “spikes” in the VixFix indicator highlight “fear” on the part of traders regarding the security in question, which may in turn highlight a buying opportunity.vix 1Figure 2 – SPX with VixFix (top) vs. Vix Index (bottom) (courtesy AIQ TradingExpert)
Going Two Steps Forward

For better or worse, I have never been one to “leave well enough alone” (Sorry, it’s just my nature).  So I eventually “double smoothed” the original VixFix indicator to get something a little less, um, “jumpy”.

What I came up with I call the “VixAverageAve” and is calculated as follows:

Highest Close=Highest closing price in most recent 22 trading day

Williams VixFix=(((Highest Close – Today’s Low)/ Highest Close)*100) + 50

VixFixAverage= 3-day exponential average of William’s VixFix

Jay’s VixFixAverageAve = 7-day exponential average of VixFixAverage

The code for AIQTradingExpert EDS is as follows:

!VixFixAverageAve code

!Written by Jay Kaeppel; based on VixFix indicator created by Larry Williams

hivalclose is hival([close],22).

vixfix is (((hivalclose-[low])/hivalclose)*100)+50.

vixfixaverage is Expavg(vixfix,3).

vixfixaverageave is Expavg(vixfixaverage,7).

So what the heck does all of this do for us? Well, there are many ways to interpret and implement the results.  In the broadest stroke possible let me just highlight two possibilities:

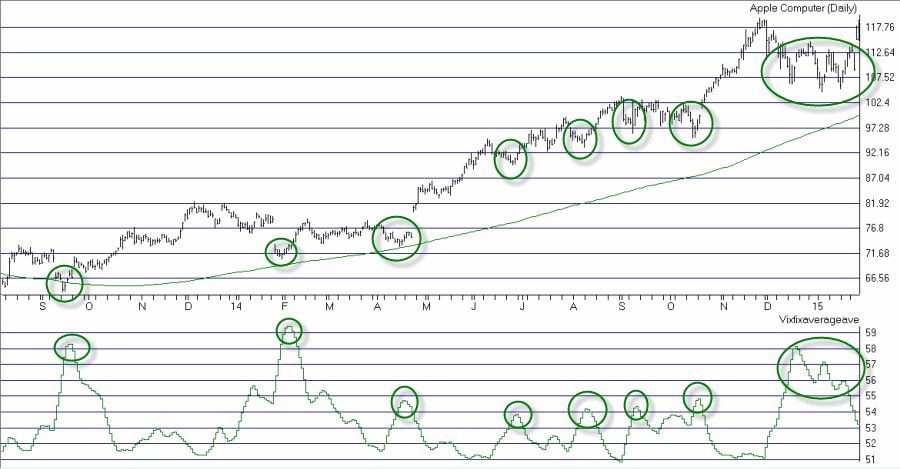
For a security trading above its 200-day moving average (i.e., in an established uptrend, traders can look for:

  1. a) a VixFixAverageAve “spike” and reversal, and or,
  2. b) a rise by the VixFixAverageAve for 6 to 8 consecutive trading days followed by a reversal

Please note that it is my opinion that waiting for the actual reversal in the indicator is essential.  These events often (but not always, ah, there’s the rub) highlight decent short-term trading opportunities.  Figure 3 displays ticker AAPL with some potential signals highlighted.aapl vixfix 1Figure 3 – Ticker AAPL with Jay’s VixFixAverageAve (courtesy AIQ TradingExpert)
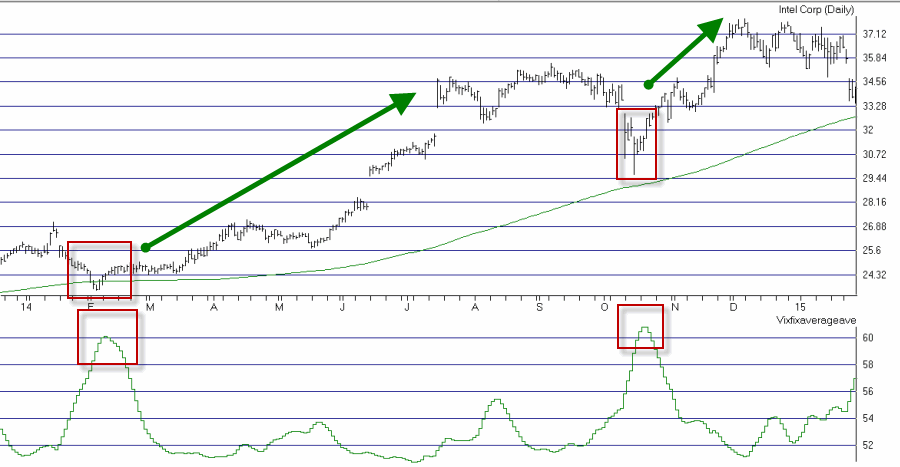
Another possibility is to consider any spike and reversal above 60 to be a potential (very) short-term buying opportunity, even if the security is below the 200-day moving average.  One word of subjective caution is to be careful if a stock or ETF appears to be in a “waterfall” decline.  Possibly the “best of all worlds” is a spike and reversal above 60 while price is above the 200-day moving average.  Figure 4 displays two such signals for ticker INTC.Vix INTC Figure 4 – Ticker INTC with price above 200-day moving average and VixFixAverageAve reverses after topping 60 (courtesy AIQ TradingExpert)
Using VixFixAverageAve with Options

One primary danger associated with any “buy the dip” indicator is the potential for attempting to “catch a falling safe.”  It’s a great trick when it works, but it can get a little, er, messy, when it doesn’t.  So one great way to trade indicators like VixFixAverageAve is via the use of options.  Let’s take a look at one example.

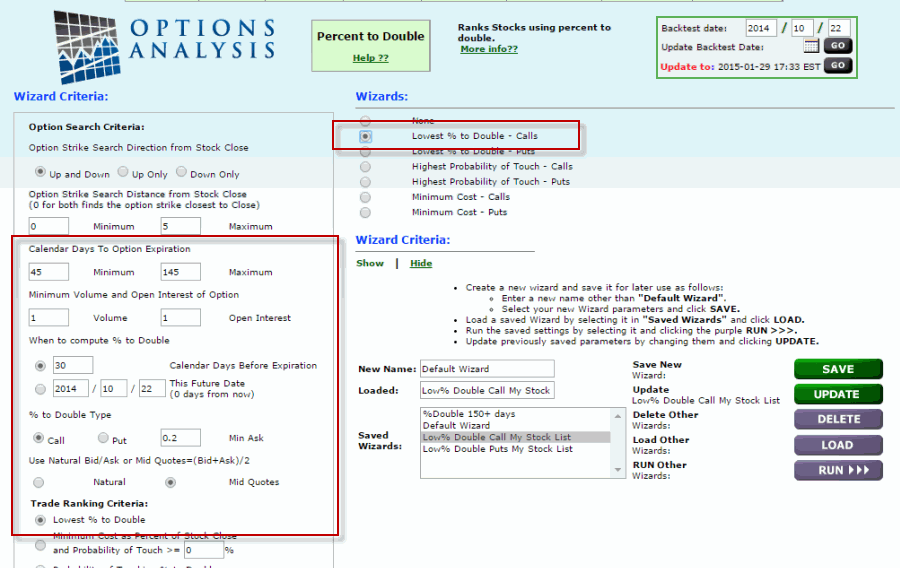
As shown in Figure 4, on 10/22/14 the VixFixAverageAve reversed down after rising above 60 for ticker INTC.  In Figure 5 you see the input screen for the “Percent to Double” routine built into www.OptionsAnalysis.com software.Pct to double input Figure 5 – Percent to Double Inputs (courtesy www.OptionsAnalysis.com)
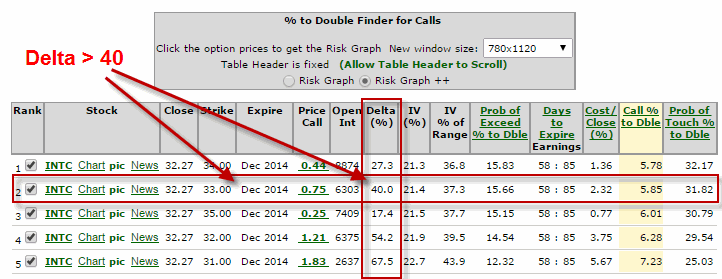
In Figure 6 you see the output.  The top recommended trade was to buy the December 34 call.  However, my own personal preference is to buy calls with a Delta of roughly 40 or more.  So I will look at the second trade listed – buying the December 33 call.

Pct to double output

Figure 6 – Percent to Double Output (courtesy www.OptionsAnalysis.com)

Figure 7 displays the risk curves for buying a 1-lot. intc rc 1
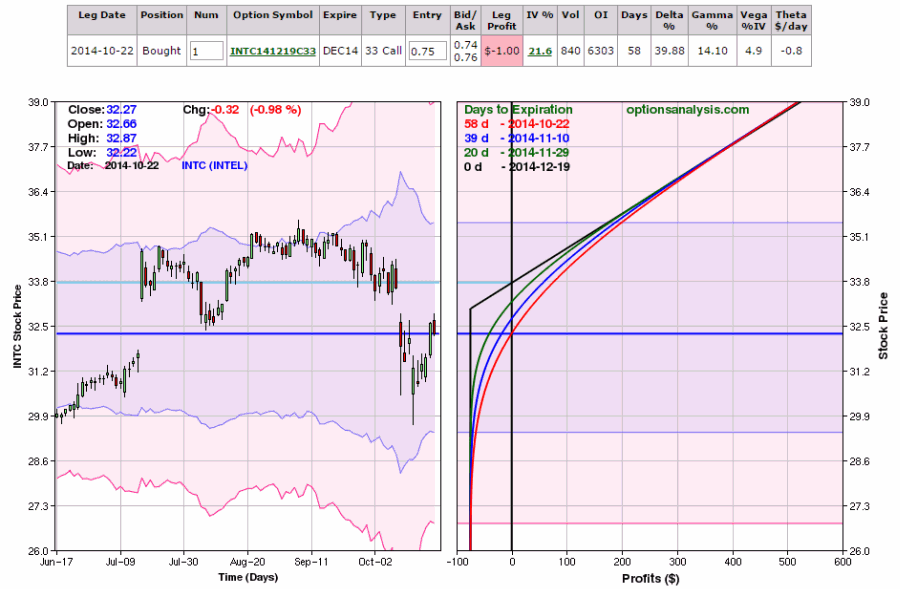
Figure 7 – Risk Curves for INTC December 33 call (courtesy www.OptionsAnalysis.com)

The advantage of this approach is that the maximum risk on a 1-lot is $75 even if the stock were to unexpectedly plummet.  Above the breakeven price of $33.75 this trade enjoys unlimited profit potential.

When to take a profit and/or adjust a winning trade is an entirely separate topic, but for the record, by 11/28 this position would show a profit of +460% following a 15% rally by INTC stock as shown in Figure 8.Intc risk curve
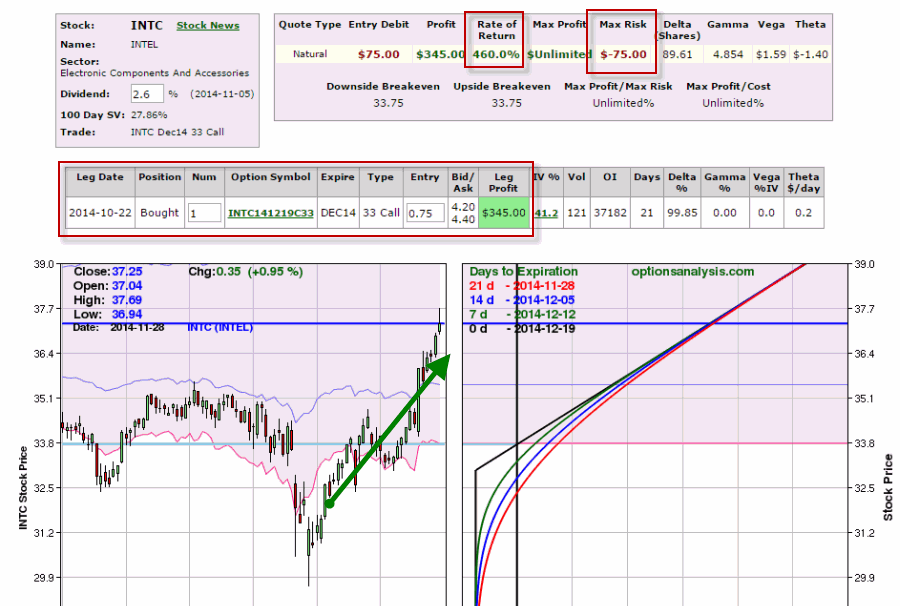
Figure 8 – INTC December 33 call gain +460% as INTC stock rallies +15% (courtesy www.OptionsAnalysis.com)

Summary

So is VixFixAverageAve the “World Beater Indicator?”  Not at all.  To expect any indicator to magically churn out great signal after great signal leading to riches beyond the Dreams of Avarice is simply not realistic.  So simply note the purpose of an indicator like this.  The real purpose of this indicator is to highlight points in time when investor “fear” regarding a given security may have gotten overdone and is about to reverse soon.  By combining that “possibility” with a low dollar risk option trade is probably not the worst idea I’ve ever come up with.

Come to think of it, I can state definitively that this is not the worst idea I’ve ever come up with.  Trust me on this one.

Jay Kaeppel
A Time for Crude and a Time, um, Not for Crude?

I like to think of myself as a creative, independent thinker.  Of course I’d also like to think of myself as handsome, charming and witty and look how that’s worked out.  But I digress.  Anyway, on my Twitter feed last week I posted a link to a piece from Stock Trader’ Almanac regarding a terrific seasonal trend in crude oil. Let’s take a closer look at what the boy’s at the Stock Trader’s Almanac lab uncovered.

The Stock Trader’s Almanac Crude Oil Seasonal Trend

The seasonal trend highlighted in the link to STA points out the fact that crude oil trends to be bullish for 60 trading days starting on February 13th (or the closest trading day to it).  As we will see in a moment, the results are compelling.  What is even more interesting is to compare the results generated by holding a long position in crude oil (or a crude oil ETF) during this time period to the results generated by holding a long position in crude oil all of the rest of the year.

The Test

For the record, the historical data that I use for crude oil futures is based on  a “continuous contract” (which basically strings together the daily price change for the currently most active contract at any given point in time), so they may not exactly reflect what a real trader might have experienced in real-time trading.  But they will be close.  And the point of this exercise is not really the “raw” returns but the “relative” returns of the “bullish” period versus “all other” periods.

So for our test:

*Bullish Period

Starts at the close of trading on the last trading day prior to February 13th each year, and lasts for 60 trading days.

*Bearish Period

Starts at the end of the 60 day period described above and lasts until the close of trading on the last trading day prior to February 13th the next year.

The Results

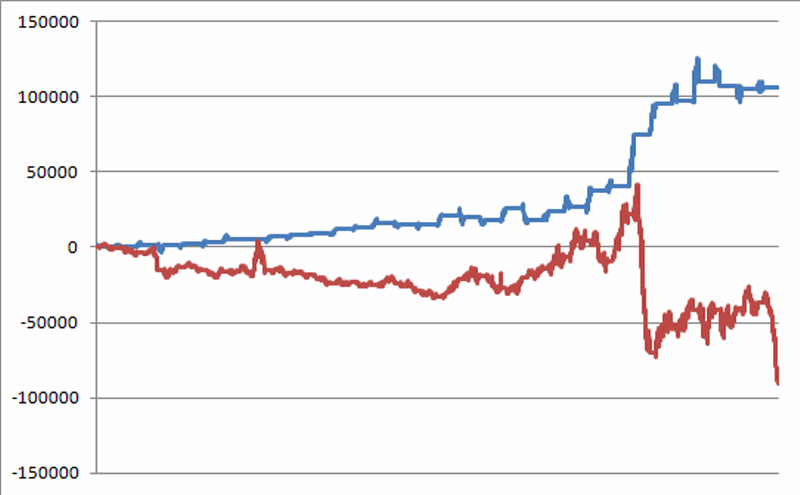
Figure 1 displays the growth of equity achieved by holding a long position in crude oil futures (a $1 move in the price of crude oil equals $1,000 change in the value of the futures contract) during the bullish period (blue line) versus holding a long position in crude oil futures during the bearish period (red line) since April 5th, 1983 (when crude oil futures starting trading).cl 1Figure 1 – $ +(-) for crude during bullish period (blue line) versus bearish period (red line); 4/5/1983 through 1/16/2014

For the record:

-During the “bullish” period crude oil futures gained roughly +$106,000.

-During the “bearish” period crude oil futures lost roughly (-$88,000)

Using ETFs instead of Futures

While the numbers above are compelling, let’s be honest, the vast majority of traders will never trade a crude oil futures contract (and in reality that is probably a good thing given the dollars and risks involved).  So what about using an ETF that tracks the price of crude oil?

The most heavily traded crude oil ETF is ticker USO.  Now I don’t wish to go into details but USO has had some – how shall I say this, um, performance issues – due to the way its portfolio is configured (i.e., it holds several months of futures contracts however, due to “contango” – whereby the farther out contracts trade at a higher price than the closer months – its share price has tended to lag the price of crude oil, particularly in up markets and, oh never mind.  If you want to know more Google “contango and uso”).

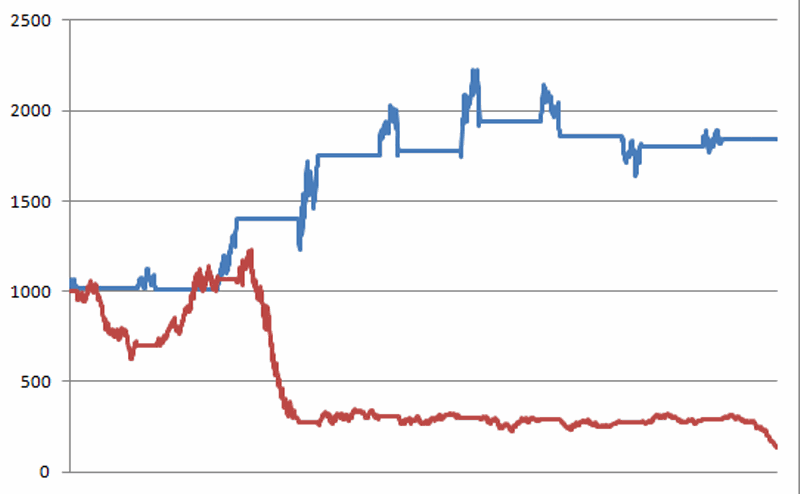
Still, the results generated by this seasonal trend via USO are pretty compelling. Figure 2 displays the growth of $1,000 fully invested in USO only during the bullish seasonal period (blue line) versus $1,000 fully invested in USO only during the bearish seasonal period (red line) since USO started trading on 4/10/2006.cl 2Figure 2 – Growth of $1,000 invested in ETF ticker USO during bullish period (blue line) versus bearish period (red line); 4/10/2006 through 1/16/2014

For the record:

-During the “bullish” period, $1,000 in USO grew to $1,861 (+86.1%)

-During the “bearish” period, $1,000 in USO declined to $146 (-85.4%)

These types of stark contrasts are what we “quantitative analyst types” refer to as “statistically significant.”

Summary

So does it make sense to simply buy and hold crude oil futures during the bullish period and to sell short during the bearish periods? Probably not.  For the record I am not advocating this as a standalone strategy. A closer look at Figures 1 and 2 reminds us that large unexpected moves can and will happen regardless of what the “seasonals” are suggesting “should” happen.  And as always, there is never any guarantee that the bullish phase will see higher prices nor that the bearish phase will see lower prices.

Probably a better way to use this information is to given the bullish case the benefit of the doubt during the bullish phase and vice versa.  To wit, should crude oil show signs of bottoming out and/or attempting to rally starting around mid-February, aggressive traders might do well to look for ways to play the bullish side.

Thanks Stock Trader’s Almanac!

Jay Kaeppel

An Update on “If You Just Have to Pick a Bottom in Crude Oil”

NOTE: If you have no interest whatsoever in option trading you are free to stop reading right now.  Still, if you are interested in trading strategies that can make money in unusual circumstances you might consider plowing forward for at least a few more paragraphs.

On December 16, 2014 I published an article titled “If You Just Have to Pick a Bottom in Crude Oil”.  For the record, I was not necessarily advocating doing so; the real point was to highlight a little known option trading strategy known as the “Reverse Calendar spread.”  The reverse calendar spread is a strategy that should only be used when implied option volatility for the security in question is extremely high, because the primary way that this trade can make money is if implied volatility subsequently falls sharply.  So let’s review the hypothetical trade I highlighted and then update to see where things stand at the moment.

The Original Trade

The original trade involved the following:

*Buy 1 Feb 2015 21 Call @ 1.46

*Sell 1 Mar 2015 21 Call @ 1.77

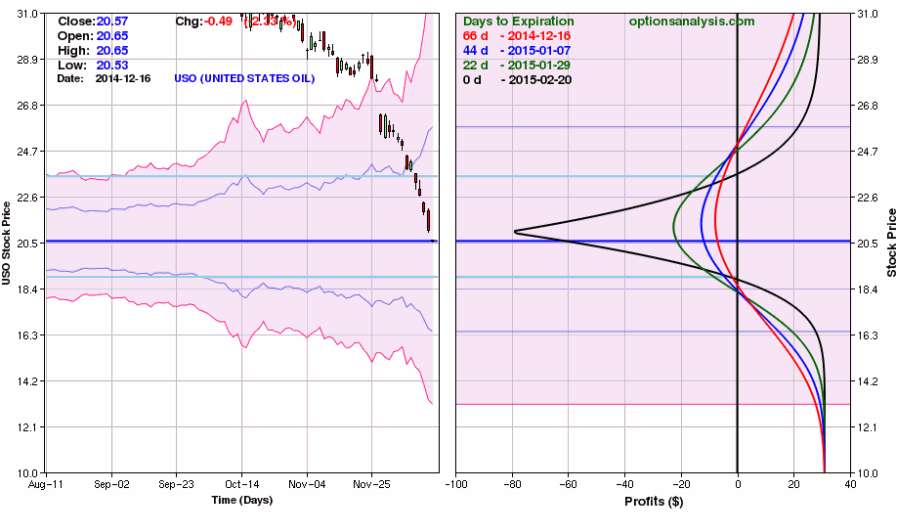
The prospects for this trade as of 12/16/14 appear in Figures 1 and 2.

cl f4

Figure 1 – Reverse call calendar spread for USO (Courtesy: www.OptionsAnalysis.com)

cl f5Figure 2 – Reverse call calendar spread for USO (Courtesy: www.OptionsAnalysis.com)

The goal was to exit the trade by 2/6/15 to eliminate the risk of experiencing the maximum loss depicted by the black risk curve line in Figure 2.

So Where are We Now?

As of 12/16/14

*USO trading at 21.30

*Feb 21 Call trading at 1.46 with implied volatility of 51.60

*Mar 21 Call trading at 1.77 with implied volatility of 42.60

As of 1/13/15

*USO trading at 17.46

*Feb 21 Call trading at 0.17 with implied volatility of 49.5

*Mar 21 Call trading at 0.37 with implied volatility of 45.9

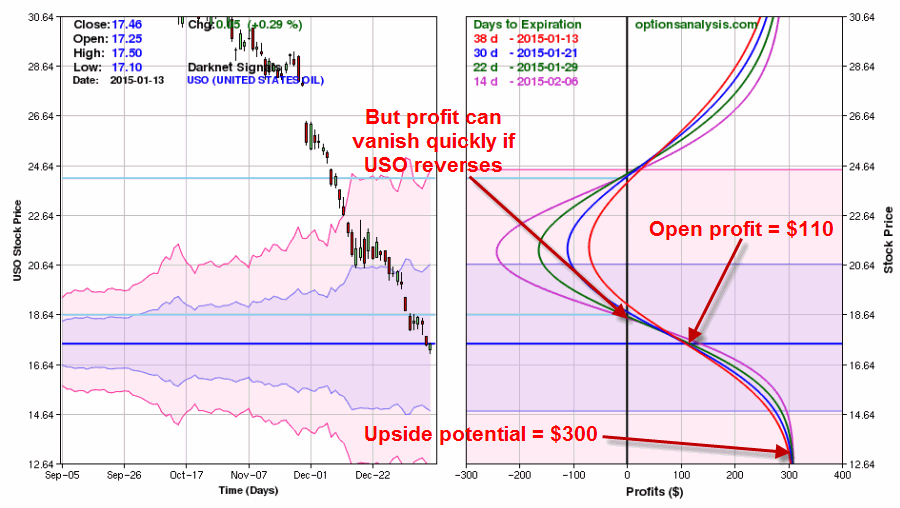
The current status of the trade (with a targeted “exit no later than” date of 2/6/15) appears in Figures 3 and 4.jotm20150113-4Figure 3 – Current status of USO Reverse Calendar spread (Courtesy: www.OptionsAnalysis.com)jotm20150113-5Figure 4 – Current status of USO Reverse Calendar spread (Courtesy: www.OptionsAnalysis.com)

As you can see, implied volatility has actually gone in the “wrong direction” on both legs (the Feb call we bought saw a slight decline in IV while the Feb call we sold saw a slight rise in IV).

However, during the same time USO has plummeted 18% from 21.30 to 17.46 a share and in the process pushed the trade below the lower breakeven point.  With an approximate maximum risk of roughly $750 (not shown in any of the graphs and can only occur if trade is held until February option expiration on 2/20/15 – which is why we have targeted 2/6/15 as the “exit by” date), the open profit of $110 represents just less than a 15% return.

Not bad for a trade that was put on (hypothetically speaking) in anticipation of:

A) A sharp upside reversal by USO, and/or

B) A sharp decline in option implied volatility.

Despite the fact that neither of these things occurred the trade is showing a profit.

Summary

It bears repeating that this is a hypothetical trade (dang).  But like I said at the outset, sometimes it’s good to know how to use certain strategies that can make money in unusual circumstances.

The reverse calendar spread certainly falls into this category.

Jay Kaeppel


Great Days for Real Estate

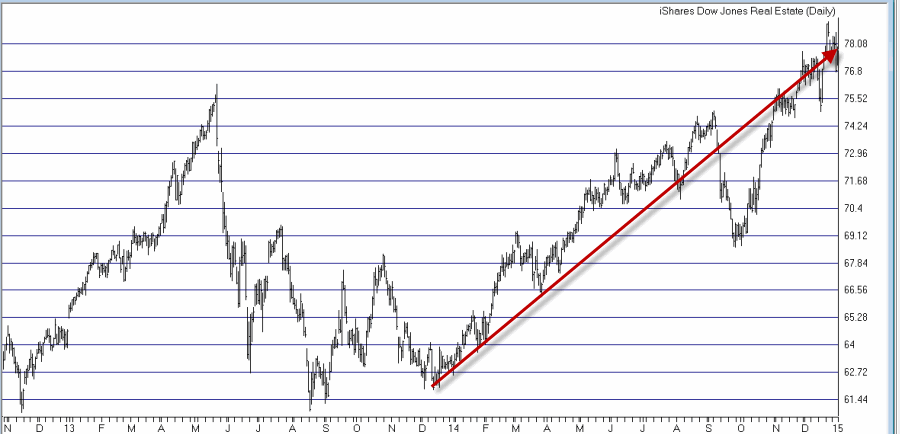
This title implies that perhaps I am talking about the fact that real estate stocks have been performing quite well of late.  As you can see in Figure 1, since bottoming in December 2013, the most heavily traded real estate ETF – ticker IYR – is up over 25%.  And that is a good thing.iyr bar chartFigure 1 – Real Estate ETF Ticker IYR (Courtesy: AIQ TradingExpert)

But the most recent rally is not what I am talking about.  I am referring more to what goes on “under the hood.”

As you may know if you (WARNING: Shameless Self-Serving Plug to follow) read my book “Seasonal Stock Market Trends”, I have a “thing” for seasonality in the financial markets.  And I also understand that this is also not everyone’s “cup of tea.”  Depending on one’s point of view seasonal trends can either be considered to be

a) Interesting and potentially useful, OR;

b) Data curve-fitting to the nth degree

Personally I choose a), but you may choose b).  And that’s OK because if we reach the point where we all trade and invest the same then there won’t be anybody left to take the other side of our trades.

The Gist of Seasonal Trends

For the record, the underlying reason that I look at seasonal trends is to attempt to find an “edge.”  I would guess that 90% of traders and investors look at fundamental and/or technical analysis.  I would guess that no more than 10% of traders and investors look at seasonal trends.  So my rhetorical question of the day is:

If you are looking for an edge in the markets does it make sense to look:

a) Where everyone else is looking, OR;

b) Where hardly anyone else is looking?

Again, the choice is yours.

The Best Days for Real Estate

For the following illustration of using seasonal trends we will use ticker REPIX, which is the Profunds Real Estate mutual fund.  For the record, this fund uses leverage of 1.5-to-1.  For those who want less risk – and are willing to settle for less return – there is the Rydex real estate mutual fund (ticker RYRIX) and many real estate ETFs – with ticker IYR being the most heavily traded.

The Strategy – We will hold ticker REPIX on the following trading days each month:

*The first two trading days of the month

*Trading day’s #8, 12 and 15

*The last four trading days of the month

Obviously this particular strategy is only for traders who are “hands on” and willing to hold positions for either 1 day (in the case of trading days 8, 12 and 15) or 6 days (the four end of month days plus the two start of the next month days).  Once again, this is obviously not everyone’s “cup of tea.”  Still, the results are fairly compelling.

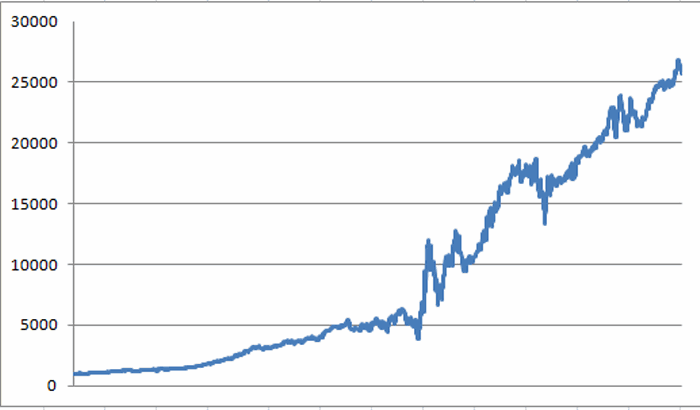
Figure 2 displays the growth of $1,000 invested in ticker REPIX only during the days listed above starting on the August 8, 2000 (when REPIX started trading).repix 1Figure 2 – Growth of $1,000 invested in REPIX during “Best Days” (Aug 2000-present)

For the record, $1,000 invested this way grew to $25,694.  Now some people will look at the return and say “hmm, that look pretty good.”  Others will look at the chart itself and say “Wow, that looks way to volatile.” But looking at a set of returns in a vacuum makes it hard to really judge things.

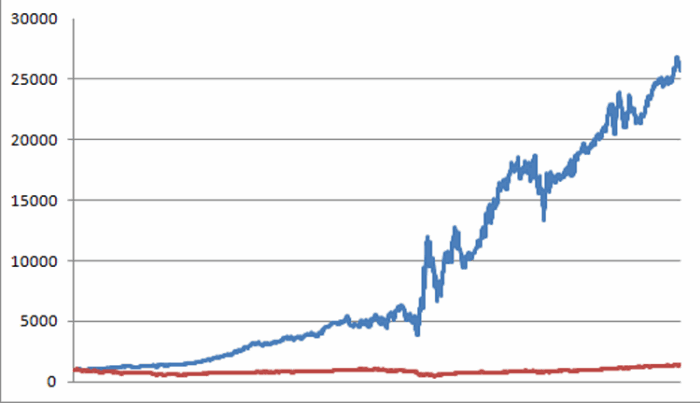
So to get a better feel for things, let’s compare the performance in Figure 2 to that of the S&P 500.  In Figure 2 the blue line represent the growth of $1,000 invested in REPIX as described above while the red line represents the growth of $1,000 invested in ticker SPY on a buy-and-hold basis over the same time period.

repix 2Figure 3 – Growth of $1,000 invested in REPIX only on “Best Days” (blue line) versus SPY (red line) (Aug 2000-present)

For the record, $1,000 invested in REPIX during seasonally favorable days grew to $25,694 (+2,469%) while $1,000 invested in ticker SPY on a buy-and-hold basis grew to $1,390 (+39%).

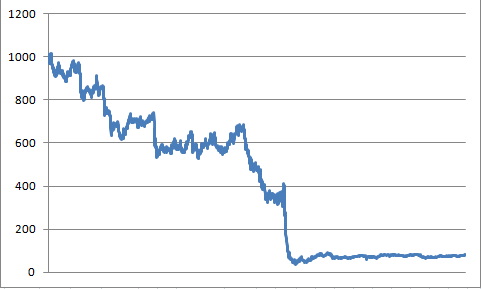
One last comparison to make is to compare the performance of REPI on “seasonally favorable” days versus “all other trading days.”  Figure 4 displays the growth of $1,000 invested in REPIX only during the trading days not listed above.repix 3

Figure 4 – Growth of $1,000 invested in REPIX only on “non favorable” days (Aug 2000-present)

$1,000 invested in REPIX only on all non-favorable seasonal days actually declined in value to just $82 (-92%).

So let’s sum up the results from August 2000:

 SPY: +39%

REPIX non-seasonally favorable days: -92%

REPIX seasonally favorable days: +2,469%

For the record, the difference in the relative rates of return listed above are what we “quantitative analyst types” refer to as “statistically significant.”

Summary

So is everyone going to now resolve to trade real estate stocks on certain days of each and every single month going forward?  Surely not.  This strategy has serious risk and volatility involved.  So this is not a “hey let’s bet the ranch” type of idea.  Still, a roughly 30% a year average annual return typically does involve some risk.

So most people will shy away from anything even remotely resembling what I have just described.  But if you carefully reread the section above titled “The Gist of Seasonal Trends” then you may come to understand that that is exactly my point.

Jay Kaeppel