Monthly Archives: November 2014

Happy Days Are Here, Um, Next Monday?

It is not a little known fact that historically the action of the stock market has been relatively favorable both around holidays and towards the end of the year.  But some question remains as to just how favorable things have been during these periods and how often.  So let’s address it.

The Year-End (or “Santa Claus”) Rally

Different analysts will look at historical data and draw different conclusions.  This is actually a good thing, otherwise everyone would be trying to buy or sell at the same time.

But in the opinion one analyst (“Hi, my name is Jay”) the “year-end rally” period (or as I like to call it the “Santa Claus Rally”):

*Starts on the Monday before Thanksgiving

*Ends at the close of the third trading day of the following January

Have I mentioned lately that this stuff doesn’t need to be rocket science?

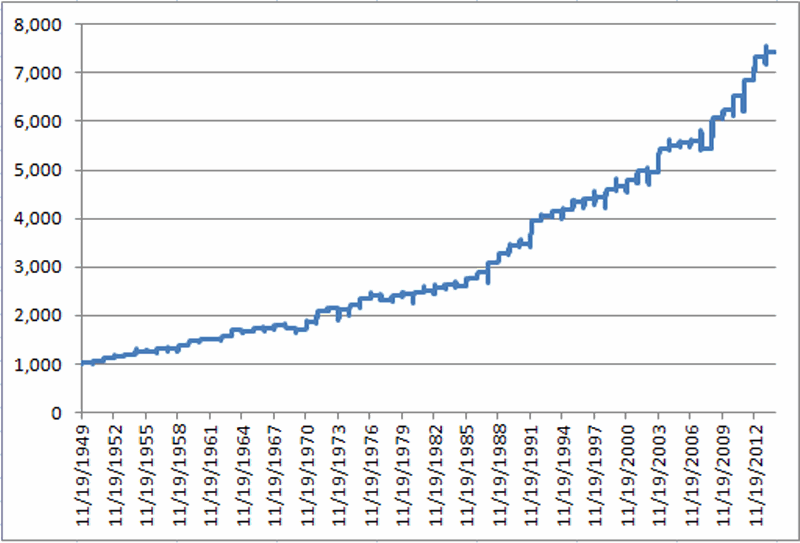
So how has this period performed?  We will start our test at the close of trading on Saturday (yes, Saturday) November 19, 1949 and examine what would have happened to a hypothetical $1,000 investment in the Dow Jones Industrials Average that was in the market only during the bullish year-end period described above (in other words, the trader would buy the Dow Industrials Average at the close on the last trading day prior to the Monday before Thanksgiving and would hold through the close of the third trading day of the following January.  The rest of the time the “system” is out of the market.  For our purposes, no interest is earned so as to reflect only the gains made during the bullish year-end period).

The results appear in chart form in Figure 1.santa rallyFigure 1 – Growth of $1,000 invested in the Dow Industrial Average only during the bullish year-end period described in text

Figure 2 displays the annual year-by-year results in table form.

Exit Date

% +(-)

1/5/50

3.6

1/4/51

4.0

1/4/52

3.9

1/6/53

4.6

1/6/54

2.9

1/5/55

5.1

1/5/56

0.2

1/4/57

3.7

1/6/58

(0.0)

1/6/59

5.7

1/6/60

5.8

1/5/61

3.2

1/4/62

(1.0)

1/4/63

5.0

1/6/64

8.2

1/6/65

(1.2)

1/5/66

3.0

1/5/67

(0.5)

1/4/68

4.3

1/6/69

(3.1)

1/6/70

(2.4)

1/6/71

10.0

1/5/72

11.6

1/4/73

3.4

1/4/74

(1.2)

1/6/75

3.6

1/6/76

6.0

1/5/77

3.1

1/5/78

(3.7)

1/4/79

3.6

1/4/80

1.6

1/6/81

1.5

1/6/82

0.9

1/5/83

2.3

1/5/84

2.5

1/4/85

(0.3)

1/6/86

5.7

1/6/87

4.3

1/6/88

6.5

1/5/89

6.2

1/4/90

5.4

1/4/91

0.6

1/6/92

13.9

1/6/93

2.4

1/5/94

2.8

1/5/95

0.9

1/4/96

3.7

1/6/97

1.5

1/6/98

0.3

1/6/99

4.2

1/5/00

1.1

1/4/01

2.7

1/4/02

4.0

1/6/03

(0.4)

1/6/04

9.5

1/5/05

1.3

1/5/06

1.1

1/5/07

0.4

1/4/08

(2.9)

1/6/09

12.0

1/6/10

2.5

1/5/11

4.6

1/5/12

5.3

1/4/13

6.7

1/6/14

1.6

Figure 2 – Year-by-Year “Santa Claus Rally” % +(-)

A few performance notes:

# times UP = 54 (83% of the time)

# times DOWN = 11 (17% of the time)

Average% +(-) = +3.19%

Median % +(-) = +3.08%

Largest % Gain = +13.87% (1991-92)

Largest % Loss = (-3.69%) (1977-78)

It is also worth noting that the year-end rally period has witnessed a gain for the Dow in 27 of the last 29 years and 33 of the last 36 years.

Summary

So do the results displayed in Figures 1 and 2 guarantee that the stock market is destined to rally in the near future?  Ah there’s the rub.  For the answer is “not necessarily”.  Still, investing is in many ways a game of odds and probabilities.  While one always needs to be prepared to act defensively if things start to go south, history suggests that traders and investors might do well to give the bullish case the benefit of the doubt between Thanksgiving Week and early January 2015.

Or to put it more succinctly:

Jay’s Trading Maxim #215: Santa Claus is real (approximately 83% of the time).

Jay Kaeppel

Darknet Channels Strikes Again

In the May 2014 issue of “Technical Analysis of Stock, Commodities & Forex” magazine, I co-authored an article with John Broussard, a former colleague of mine.  John is the purveyor of www.OptionsAnalysis.com and developer of the Darknet Channels trading method.

Now when I say that we “co-authored” the article, in this case that breaks down sort of like this:

John: Researched, tested, designed, developed, programmed, refined, launched and maintains the Darknet Channels system.

Jay: Ran spell check and grammar check.

In addition, Jay also wonders why – even though John thoroughly explained the calculations and methodology behind Darknet Channels – he still doesn’t full understand exactly how they work.  Alas, some questions are best left unanswered.  But hey, at least the spelling and grammar look good.

Darknet Channels: The Broad Stroke

In a nutshell, Darknet Channels involves calculations that draw three sets of price channels which we will refer to as long, intermediate and short-term channels.  When all three sets of channels are pointing lower and long short-term and intermediate-term channels are contained within the longer-term channels, then the stage is set for a buy signal (a reversal in price is required first in order to avoid attempting to “catch a failing safe”).

Once a buy signal occurs then the system looks for the opposite configuration – i.e., all three channels are pointing higher and the short and intermediate-term channels are contained within the longer-term channels.  Then the stage is set for a sell signal.  Once again, reversal in price of some degree is required to trigger the actual signal. 

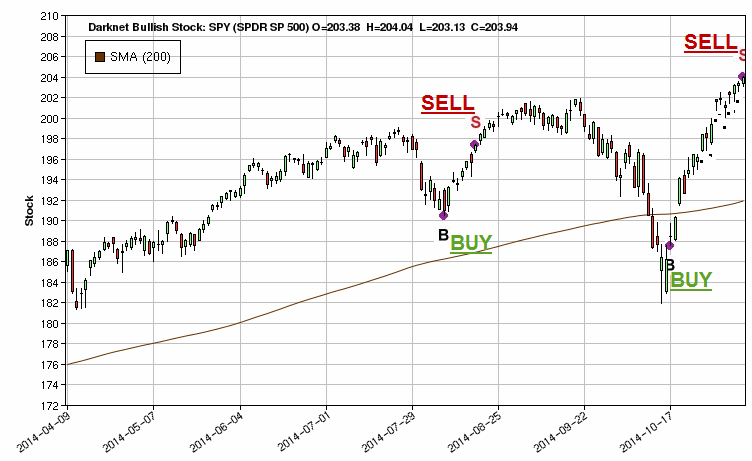
Figure 1 displays some recent example signals for ticker SPY.spy darknetFigure 1 – Darknet Signals for SPY

Trading with Darknet Channels

www.OptionsAnalysis.com generates Darknet Signals for a large number of stocks.  Also, the software generates signals on Stocks, Call Options and Put Credit Spreads.  It likewise has its own built in methodology for selecting specific options to trade. 

Not being one to leave well enough alone (Sorry, its jut my nature), I have my own list of tickers that I follow and my own method for selecting call options to consider based on the trading signals that the software generates.

My “short list” of tickers includes:

AXP BA DIA EEM IBB IWM SPY SSO XHB XLB XLF XLI XLP XLV XLY XOP

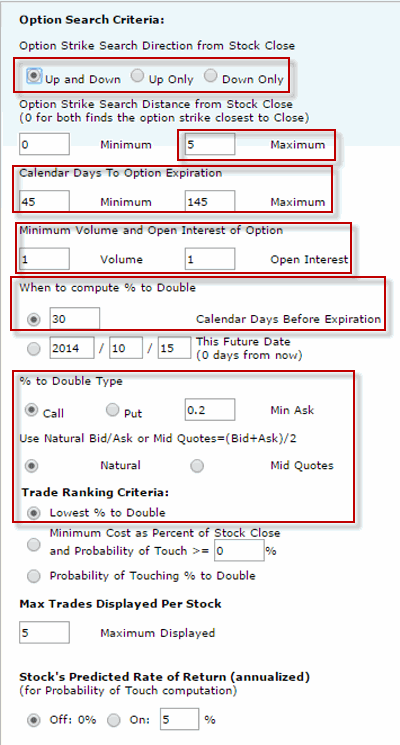
Also the method I use for selecting options for consideration uses the following inputs in the % to Double routine built into www.OptionsAnalysis.com:darknet input 

Figure 2 – Jay’s Option Selection Inputs

The primary things to note among the inputs are:

*At least 45 days until expiration

*Volume and Open Interest of at least 1 (i.e., ignore call options that never trade)

*Use the “Natural” price (i.e., the ask price) for evaluation purposes (this give you an idea of what price you might get if you placed a market order)

I make no claim that these are the “best” selection criteria to use.  They are based on certain personal preferences (I would rather buy a slightly longer term option than to have to “roll out”, I don’t like to look at options that never trade and I like to consider my “worst case, what price do I buy at if I place a market order” scenario, rather than assuming that I can get filled at the midpoint of the bid/ask spread).  That being said, traders may often be better off buying with a limit order than a market order.  

In sum a trader can follow the trades suggested by the software, use the criteria I have listed above, or device some other variation – for example, some traders might consider deep-in-the-money call options as a “stock replacement” strategy.

Some Recent Results

The results displayed in Figure 3 are hypothetical and represent just one recent set of results from using Darknet Channels buy signals and the option selection criteria shown above.  It is assumed that $2,500 is dedicated to each trade.darknet hypothetical results Figure 3 – Hypothetical Results of Recent Darknet Channels signals

The results in Figure 3 do not include any deductions for slippage or commissions, so net returns would be less than they appear in this table.  Still, the gist is that investing up to $2,500 into each of these 8 positions – at a cost of around $20,000 – would have generated close to a doubling of capital before slippage and commissions.

Summary

No trader should look at any set of hypothetical results and come away with stars in their eyes.  The market had a great rally off of the October low so good gains were obviously there for the taking for call buyers.  But the real point of this piece is not so much to “sell” you on Darknet Channels as it is to make you “aware” that a mechanical and back tested model is available that can generate these types of returns under the right circumstances. 

For more information visit www.OptionsAnalysis.com.

Jay Kaeppel

Actually Doing Something with The 40-Week Cycle

Last time out I revisited the 40-Week Cycle in the stock market.  Or as I sometimes refer to it, the “Wow this sounded like a really stupid idea when I first read about it, I don’t remember where, 30 some odd years ago, but darned if it hasn’t held up reasonably well Cycle” (so you see why I typically just go with the shorter version).

In the last piece I spelled out the “numbers” and I pointed out the fact that the “bullish phase” is most certainly not always bullish and that the “bearish phase” sees the stock market advance more often than it sees it decline.  But over the long-term the difference in results has been rather stark (with “stark” being defined in this case as a gain of +3,538% during the bullish phases – assuming the 12.5% stop-loss was respected – versus a loss of -31% during the bearish phases. 

I also stated quite clearly that “No one should rely on the 40-week cycle as their sole method of market analysis.”  Which is all perfectly logical.  But it does raise a rather pesky question of “So what the heck do I actually do with this thing, anyway?”  The short answer is “combine it with something else.”  Let me give you an example.

A Model Incorporating the 40-Week Cycle

So let’s build a simple (with “simple” in this case being defined as “Jay thinks its simple”) model that incorporates the 40-Week Cycle as a factor.  In addition to that cycle we will also incorporate the “Best Six Months” pattern and the 50-day/200-day moving averages for the Dow Industrials.  So heretofore I will refer to this as the “296 Model” (40 + 6 + 50 + 200).

296 Model Tool #1 – The 40-Week Cycle:

As defined last week, every 280 calendar days (the latest period started at the close on 10/31/2014) the stock market enters a “bullish phase” that lasts for 140 calendar days or until the Dow drops 12.5% from its price at the start of the current bullish phase.  The rest of the time this Tool is in cash.

296 Model Tool #2 – The Best 6 Months:

This well known phenomenon from Yale Hirsch and Stock Trader’s Almanac fame turns bullish at the close on the last trading day of October and turns bearish at the close of the last trading day of the following April.

The 296 Model – Tool #3: The 50-day versus 200-day Moving Averages:

This tool turns bullish when the 50-day moving average for the Dow Industrials rises above the 200-day moving average.  It stays bullish until the 50-day moving average drops back below the 200-day moving average.  And so on and so forth.

296 Model Scoring:

When a “Tool” is “bullish” it adds 1 point to the model

When a “Tool” is “bearish” its adds 0 point to the model

So the score for any given day can range anywhere from 0 to +3.  Intuitively, we would expect better market results when the readings are higher than when they are lower.  And in this (rare, at least when it comes the stock market) case, intuition proves to be fairly spot on.

The 296 Model Results

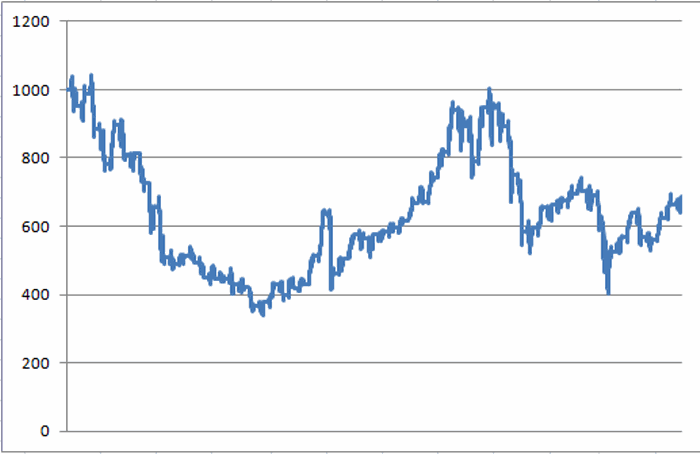
We start our test on 12/31/1967.  We will refer to readings of 0 or +1 as “bearish” for reasons that become more apparent with a perusal of Figure 1.  Figure 1 displays the growth (or perhaps I should say “lack thereof”) of $1,000 invested in the Dow Jones Industrials Average only on those days when the 296 Model registers a reading of 0 or +1.  40-6-50-200 BearFigure 1 – Growth of $1,000 invested in the Dow Industrials only when The 296 Model is at 0 or +1 (12/31/67-present)
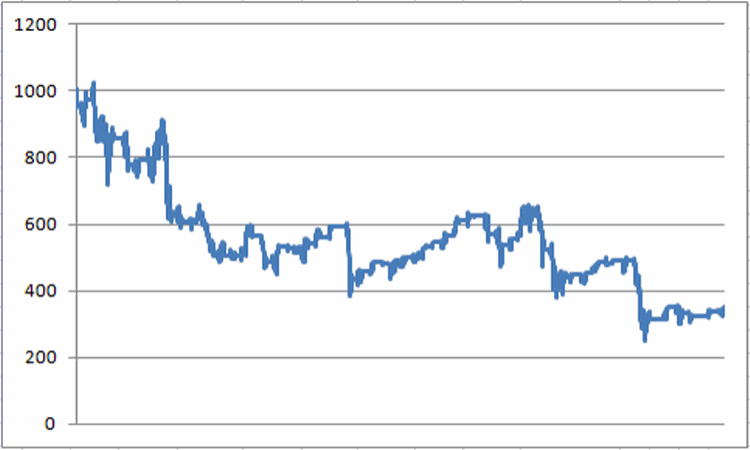
As with the 40-week cycle bearish phase chart last week, a close look at Figure 1 reveals that there are plenty of times when stock market advanced along the way.  So just because we refer to these readings as “bearish” no one should assume that the stock market is automatically guaranteed to decline.  Still, what is significant is that all told, since the end of 1967 this $1,000 would have declined in value to $349 (or -65.1%).  Which is not exactly the kind of long-term growth most investors are looking for. 

Figure 2 displays the growth of $1,000 invested in the Dow Jones Industrials Average only on those days when the model registers a reading of +2 or +3.  Also, 1% of interest per year is added when out of the stock market.
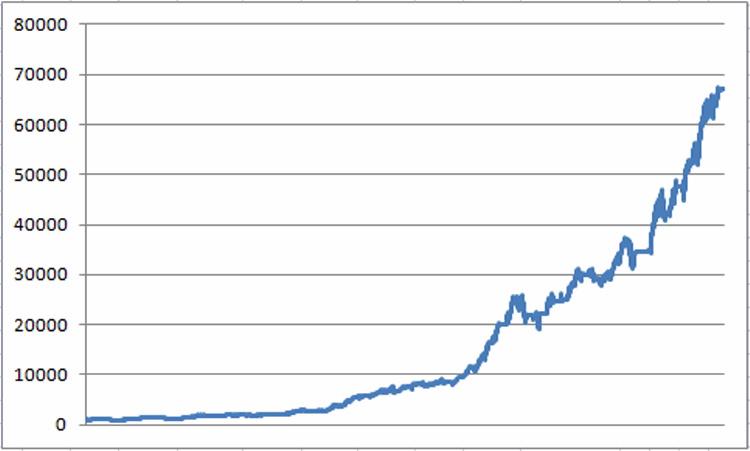
40-6-50-200 Bull Figure 2 – Growth of $1,000 invested in the Dow Industrials only when The 296 Model is at +2 or +3 (12/31/67-present)

A simple visual observation suggests that the results depicted in Figure 2 are “better” than those that appear in Figure 1.  In fact, $1,000 invested in the Dow only when the 296 Model stands at +2 or +3 (with 1% annual interest while in cash) grew to $67,012 (or +6,601%).

So a quick review:

*296 Model Bullish % +(-) = +6,601%

*296 Model Bearish % +(-) = (-65%)

These are the kinds of numbers that we “quantitative types” refer to as “statistically significant.”

Also, the maximum peak-to-valley drawdown for the 296 Model was -29% versus -54% for buy and hold. 

The 296 Model turned bullish at the close on 10/31/14 when both the 40-week cycle and the Best 6 Months turned bullish raising the model reading from +1 (the 50-200 moving average was already bullish) to +3.  The model will remain above +1 at least until 3/20/2015 (when the 40-week cycle returns to “bearish”).  As we will see in a moment, this may or may not prove significant.

A Closer Look at the Results

Now if I were smart I would write my typical snarky Summary and hit “Publish.”  But alas, well, never mind.  In any event, in this case I feel compelled to go the extra step and point out the critical difference between:

A) “Building a model” (which is the easy part) and;

B) “Actually trading using said model” (which is the hard part).

Which reminds me of:

Jay’s Trading Maxim #132: Between theory and reality there can be a chasm a mile wide.  So look for a sturdy bridge when attempting to cross from one to the other.

On the surface the numbers for the 296 Model look pretty darn good.  But the reality is that a lot of imperfections can get glossed over during the course of 37 years (come to think of it, a lot of hair can disappear also.  But I digress).  So before anyone gets the bright idea that they should adopt the 296 model right away, at least consider the following “bad news”:

1) In a nutshell, the Model’s average annual gain was +10.4%, versus +7.8% for Buy/Hold (this includes no dividends in the calculation, so the total return for both the Model and buy and hold would be several percentage points higher).  Not bad, but not exactly eye-popping either.

2) The Model did show a gain in 38 of 47 years versus 34 up years for buy and hold.  But the bad news is that the Model actually underperformed buy and hold 26 out of 47 years. 

This last piece of info is a little shocking and highlights the real fact behind how the Model outperforms buy and hold over time: It simply “doesn’t get clobbered” as often or to the same extent as buy and hold during bear markets.

So the good news is that when the market gets whacked, the 296 Model trader may well be sitting in cash and missing out on all of the “angst.”  On the other hand, during a rip roaring bull market the Model trader will also find him or herself occasionally sitting on the sidelines as prices soar.  This can be a very frustrating state of affairs.

In reality, a lot of traders and investors subconsciously adopt the “That Championship Season” mentality when it comes to trading.  In other words, if we didn’t beat the market this year then we didn’t “win the championship” regardless of the long-term affect.  For example, let’s say over a two year period that during Year One the Model made 14% and buy and hold made 20%. The next year the Model makes 1% while buy and hold loses 20%.

After two years the Model investor will see $1,000 grow to $1,151, whereas a buy and hold investor would have only $960.  Still, human nature being what it is, the average Model trader will look at the Model as being 50/50 against the market, i.e., one year it beat the market, the next year it did not.  All in all this highlights the never-ending need for discipline in following any trading method or model.

To put a fine point on all of this consider these two slightly incongruous facts:

1) Since the end of 1990, the 296 Model has underperformed buy and hold during 16 of those 24 calendar years (including 2014 to date).  Let’s face it, the average trader would likely find this a little hard to take.

2) On the other side of the coin, despite this fairly brutal year-by-year comparison, since the end of 1990, $1,000 invested in the Dow using the 296 Model grew to $10,023 versus $6,601 using a buy and hold approach. 

How is this possible?  As mentioned above, and as seen in Figure 3, the Model “doesn’t get clobbered” as often as buy and hold.40-6-50-200 Model 1990+ Figure 3 – Growth of $1,000 for 296 Model (red line) versus Buy and Hold (blue line) from 12/31/1989 to present
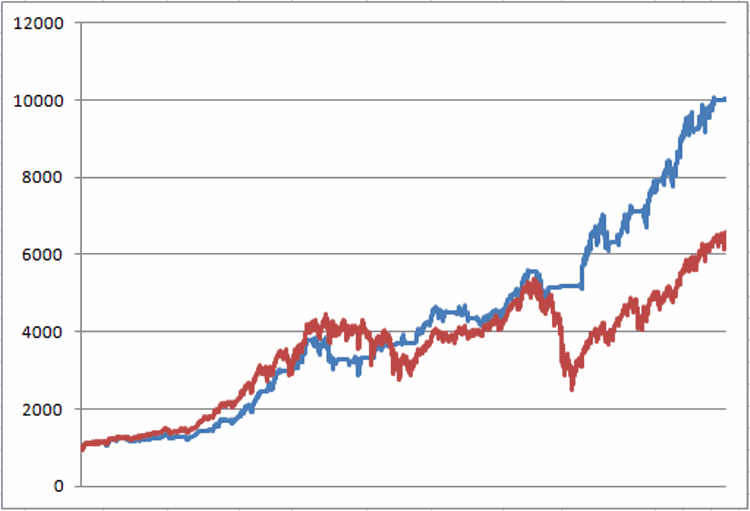
So despite the fact that the 296 Model did not have many “Championship Seasons”, it still managed to gain 1.6 times as much as buy and hold (+902% versus +560%).  Go figure. [I am getting a little tired so please insert your own “Tortoise vs. Hare” type analogy here].

Summary

When it comes to trading coming up with “interesting ideas” is relatively easy.  In fact, coming up with models that outperform a buy and hold approach is not as hard as many people assume. 

Unfortunately, actually using those “interesting ideas” and models to trade can sometimes prove a great deal more difficult.  By virtue of human nature we want to make money, we want to make money right freaking now, and we want to consistently make more money in the future.  And if we are underperforming the overall market for any length of time then “something is wrong” and we will more than likely feel compelled to “do something” – which more often than not will ultimately work against us, Murphy’s Law being what it is and all (Wow, is human nature a pain in the rear or what?).

The 296 Model I’ve detailed here is a perfectly good case in point.  Three useful tools – each with a good standalone track record – combined into one “weight of the evidence” model which generates results that are inarguably superior to buy and hold.  Sound great, right?

But unless you understand how it manages to achieve that outperformance (by missing some of the big “downs” – but alas, also some big “ups”) and unless you have the psychological wherewithal to withstand “underperforming the market” over the course of several years and still “stay the course”, achieving those really great long-term results may be problematic.

Which leads me to conclude with:

Jay’s Trading Maxim#2: There are two keys to trading success; the first is to develop a well-though out method that has a realistic probability of generating profits in real-time trading (i.e., you must have a plan). 

Jay’s Trading Maxim #3: The second key to trading success is that you must have the emotional and financial wherewithal to follow your plan.

(Ironic) Hint: While #2 can involve a lot of work and effort, for most people #3 is way harder than #2. 

Jay Kaeppel
The 40-Week Cycle Revisited

As I mentioned last time around, when it comes to analyzing the financial markets, I am a proud graduate of “The School of Whatever Works”.  In my youth I “wrote down” a lot of interesting analysis ideas (that’s how we did it back then, sadly).  Whenever I would hear or read of a new market analysis or market timing idea, rather than passing judgment one way or the other based solely on my own “youthful wisdom” (har, good one), I would agnostically write it down and “track it for awhile”.  OK, “quantitative” is  not a word that most “youths” get around to using until, well, whatever it is that comes after youth (which I believe most people refer to as “Mid-20’s and broke”, or alternatively, “Our parents have stopped feeding us, now what?”  But I digress).

At lunch time I would take a break from my job in “Personnel” (which coincidentally is where I came to realize that I “hate people” and that I was going to have to do something that involved numbers instead) and go to the local library and peruse the available market newsletters, advisory services, etc.  Anyway, I had quite the appetite for “market analysis” so I “wrote down” a lot of “stuff.” 

Long story short, if I had a $1 for every idea/method I wrote down that did not stand the test of time, well, let’s just say I wouldn’t need to worry about analyzing the financial markets anymore.  But I guess that shouldn’t really come as a surprise.  What surprises me more is some of the ideas that I would likely have considered “arcane” (had I actually used that word in my youth) that actually did end up standing the test of time (at least so far).  One of those is something I refer to as the “40-week cycle.“ 

Now I am certain that I personally did not “invent” the 40-week cycle.  I must have read about it somewhere (OK, original thinking isn’t my strong suit, is that a crime?),written it down and followed it.  But sadly, I don’t remember exactly when or where or from whom I first got the idea.  But whoever you are, if by some strange twist of fate you are reading this article, let me just say “Thanks.”

The 40-Week Cycle   

For the record there is the “Raw theory 40-week cycle” and the “Raw theory 40-week cycle with a stop-loss provision added because you know how that pesky stock market loves to crater even the best theories every once in a while” version (which I considered as the title for my next book but my editor emphatically said “No!” Guess the price of ink must be up these days).

The Rules are pretty simple:

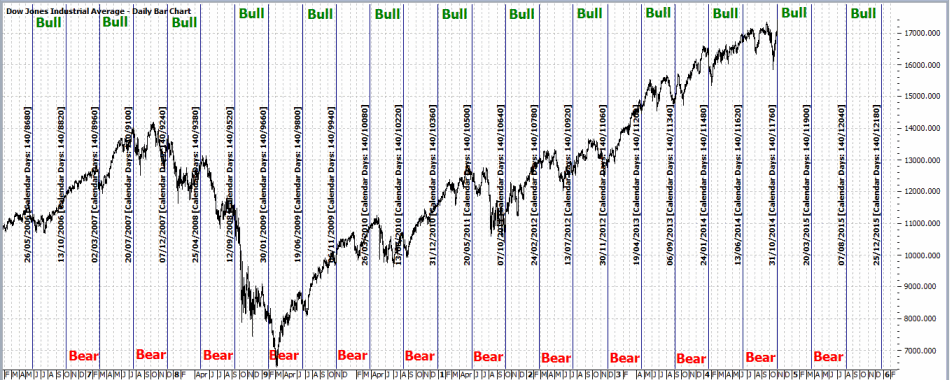
*Starting at the close on 4/21/1967, the first 140 calendar days (20 weeks times 7 days) is considered the “Bullish Phase”

*The second 140 calendar days is considered the “Bearish Phase”

*During the Bullish Phase, if the Dow Jones Industrials Average losses 12.5% or more from its closing level at the end of the previous “Bearish Phase”, sell and remain in cash until the start of the next Bullish Phase.

Figure 1 displays this cycle going back a few years.40 week hubb Figure 1 – Dow Industrials with 40-Week Cycle dates (Courtesy: ProfitSource by HUBB)

There are three critical things to know about the raw 40-week cycle:

1) The stock market DOES NOT always go UP during each bullish phase.

2) The stock market DOES NOT always go DOWN during each bearish phase (in fact, for the record, the “Bearish Phase” has seen the Dow advance more often than it declined.  But when it does decline, it “really declines” – see Figure 3 below).

3) No one should rely on the 40-week cycle as their sole method of market analysis (even at the peak of “Youthful Wisdom”)

With those caveats in mind, let’s look at why it still may be useful to keep an eye on this cycle as a “weight of the evidence” tool.

The Results

For measuring results during the “bullish” phase:

Buy the Dow at the close on the last day of the previous Bearish cycle.

Sell if either:

a) The Dow declines 12.5% or more on a closing basis from the buy price, or;

b) 140 calendar days go by if a) is not triggered

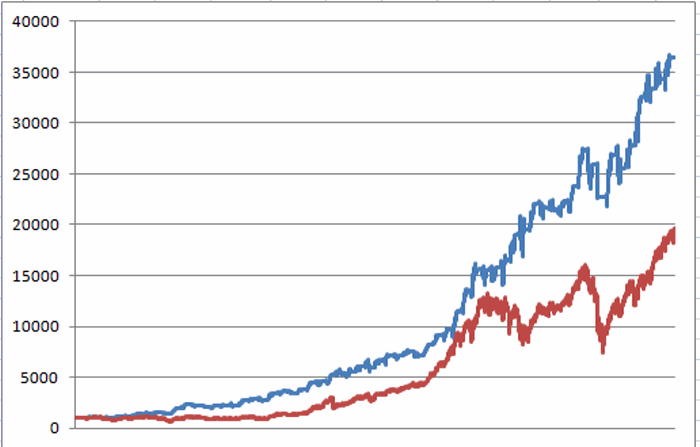
For our purposes, we will assume that interest is earned at a rate of 1% per year while out of the stock market.  Starting on 4/21/67, $1,000 invested using the rules above would be worth $36,483 as of 10/31/14, as shown in Figure 2.40wk v bhFigure 2 – Growth of $1,000 using 40-Week Bullish Phase Rules (blue line) versus Buy and Hold (red line)

On the flip side, had an investor skipped all of the “bullish” days and invested only during the “bearish” days (including after the 12.5% stop was hit), he or she would have done, ahem, worse.  The growth of $1,000 invested only during the “non bullish” days appears in Figure 3.40wk bearFigure 3 – Growth of $1,000 invested only during “Non Bullish” 40-Week Bullish days

To be succinct:

*$1,000 invested only during the “Bullish” days grew to $36,483 (+3,548%)

*$1,000 invested only during the “Non Bullish” days shrank to $688 (-31%)

Summary

The latest bullish phase started at the close of trading on 10/31/2014 (and extends through 3/20/15).  This nicely coincides with the “Bullish Six Months” period originally espoused by Yale Hirsch which (according to my own rules) extends from the close of trading on October 31st each year through the third trading day of the following May.  So does this combination of bullish seasonal factors guarantee us that “Happy Day are Here Again?” 

Sadly, no.  Murphy and his d$%^ Law stand ever vigilant against complacent investors. But if history is a guide (and “sometimes” it is) we might continue to give the bullish case the benefit of the doubt.

Well, at least for another 139 days.

Jay Kaeppel