…watching the trend roll away.
Once I gain I apologize for the lack of posting activity of late. It just seemed that there wasn’t much that needed to be said about the seeming perpetual state of affairs:
Step 1. Each day the world descends a little further into chaos
Step 2. The financial markets couldn’t care less (i.e., stocks go up, interest rates remain mostly unchanged and gold goes down)
What else do you need to know?
Despite the fact that I spend a pretty fair amount of time gazing at the world around us and shaking my head I have remained steadfastly in the bullish camp throughout 2014 – despite the fact that my “gut” said it would be a good year to “Sell in May” (Sometimes I wish gut would keep its big mouth shut) – for no other reason than the simple fact that the stock market has remained in a pretty obvious uptrend throughout. Which reminds me of:
Jay’s Trading Maxim #129: Despite all the information that swirls around us every minute of every day, sometimes, sitting around doing nothing is a pretty good investment strategy. Ironically, sometimes it’s also the hardest one to follow.
And now we stand on the cusp of what historically has been the most bullish time of the decade (September 30th – Mark Your Calendar). In regards to the article in that link I recently had an “interesting” discussion on the topic. It went something like this.
Other person (heretofore, OP): So I see you are bullish on the stock market for the next 18 months.
Me: Really?
OP: Yeah, I saw your article where you predicted that the stock market would rally sharply during the mid decade months.
Me: Um, that wasn’t really a prediction.
OP: Well, what the hell was it then?
Me: Um, it was mostly a history lesson to alert investors to an interesting historical trend.
OP: So you don’t think it’s gonna work this time?
Me: I don’t know if it will work or not this time around.
OP: Well then what did you bring it up for?
Me: Actually, I didn’t bring it up, you did.
OP: Huh, what? No you wrote the article – what for?
Me: I thought it was a pretty interesting and persistent historical trend.
OP: Yeah, but if you don’t think it’s gonna work this time around then what’s the point of bringing it up?
Me: I don’t know if it will work or not this time around – and I didn’t bring it up, you did.
OP: Well (frustration building – not to mention alcohol beginning to kick in), what kind of market forecaster are you anyway?
Me: I’m not a market forecaster.
OP: Sure you are, I read your stuff all the time.
Me: God bless you for that sir, but I don’t really try to predict what will happen next.
OP: So you don’t even have the courage of your convictions!?
Me: Well, there’s a very fine line between courage and stupidity…
OP: What’s that supposed to mean?
Me: Precisely.
OP: You wanna step outside pal?
Me: Um, we already are outside…..this is your back yard, remember?
OP: So you don’t know anything about the stock market AND you’re a smart aleck.
Me: Well……
And so on and so forth.
Which leads us to:
Jay’s Trading Maxim #127b: Sometimes not thinking about and not talking about the financial markets is a pretty good thing to do. Ironically, sometimes it’s also one of the hardest things to do (especially when there is alcohol involved).
Also to:
Jay’s Life Maxim #33: When you are the only sober person in an argument, remember, time is on your side. Be patient, wait for the inevitable unforced error, quietly declare victory and move away quickly but quietly (or, if all else fails, wait for your opponent to lose consciousness).
So even despite the recent weakness in the stock market – and what my gut tells me is an “obvious” topping formation forming (SHUT…UP!) – anyone who came into 2014 fully invested and has yet to make a trade this year is doing reasonably well (unless of course you were invested in small-cap stocks, but I digress).
For those who can’ fight the urge, sometimes a simple trend-following technique combined with a simple pullback and a simple entry trigger can work pretty well. For example:
1. 10-day simple MA > 20-day exponential moving average and 20-day exponential moving average above 30-day exponential moving average (this is Dave Landry’s Bowtie Method which I learned from Dave Steckler at http://www.etfroundup.com/)
2. An oversold indicator becomes, well, oversold, what else? For our purposes we will say that the 3-day RSI drops below 45.
3. The next time a daily high exceeds the previous day’s high by 0.02 points or more, then buy.
In a nutshell:
1. Trend up
2. Pullback within an uptrend
3. Short-term reversal back to the upside
Let’s assume a trader buys when the previous day’s high is exceeded by 0.02 or more following the setup described above. For simplicity’s sake we will assume that the trade is exited when the 2-day RSI rises above 75.
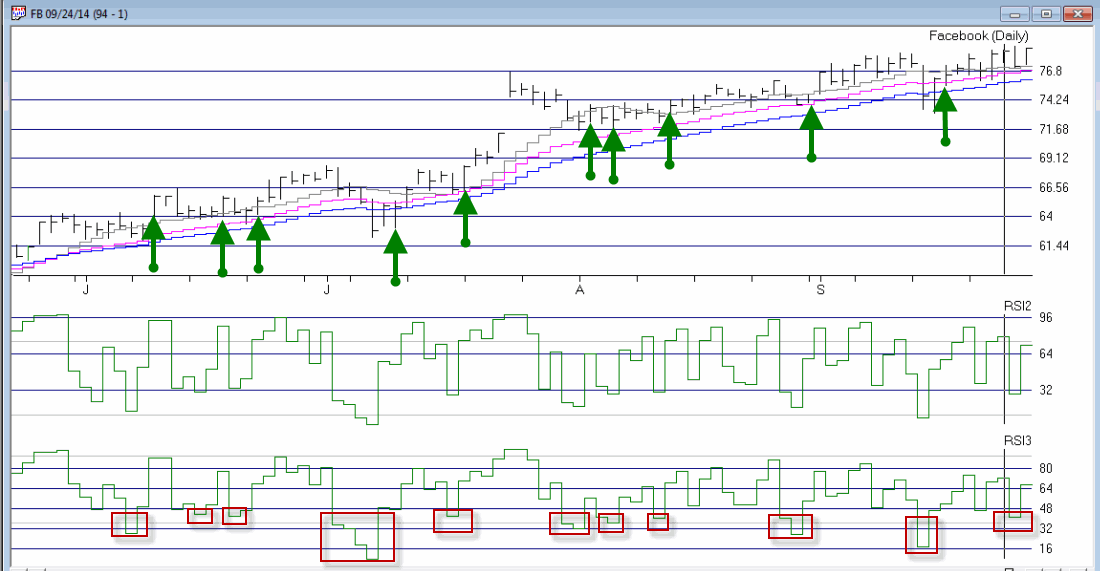
In Figure 1 you see a bar chart for FB with entry signals (i.e., price taking out the previous day’s high following a proper setup) marked with green up arrows. Figure 1 – FB in Bowtie Uptrend with an RSI pullback (Courtesy: AIQ TradingExpert)
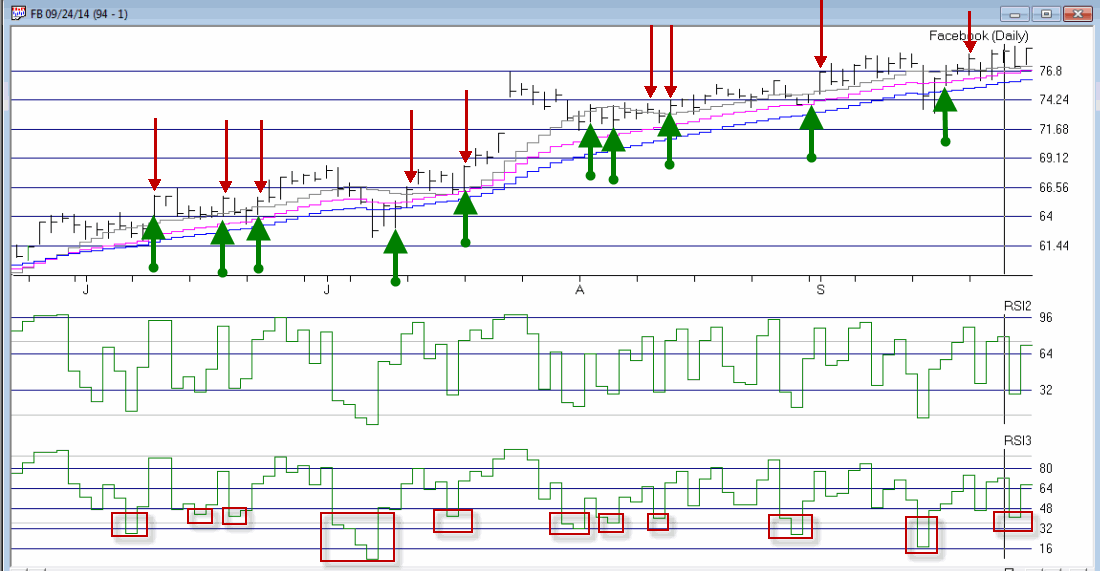
In Figure 2 we see exit signals (i.e., 2-day RSI >= 75) marked in red. In some cases the entry and exit signal come on the same day.  Figure 2 – Exit signals for FB in red (Courtesy: AIQ TradingExpert)
This method is not presented as the “be all, end off” of trading. It is simply an example of one approach for taking small bites out of a longer-term uptrend (for those of you who cannot fight the urge to “do something”).
Summary
Someday the stock market will experience another meaningful decline, interest rates will rise and gold will advance again (no, seriously) in a meaningful way. Attempting to predict in advance when that day (or days) will come is not a valuable use of anyone’s time. While traders can take advantage of trends by trading shorter-term – as I’ve just demonstrated – in the immortal words of Paul Newman in “Cool Hand Luke”:
“Sometimes nothing is a real cool hand.”
Jay Kaeppel

