Well I haven’t been posting much lately, but what’s new to say really? This is getting really boring. The financial markets I mean. Oh sure, there’s no end to the apparent chaos going on around us – Wars, genocides, beheadings, riots, and so forth. But the markets haven’t changed their tune one bit.
Stock market up, Bond market up, gold market down. Repeat.
So despite all of the turmoil, 2014 is shaping up as one of the boring years in history for the financial markets. Outside of the financial markets, American citizens are told to do exactly what we have been told to do since 9/11 – “just keep shopping.” And the 50% or so of citizens who are not receiving government check s are trying their best. Actually, the other 50% haven’t stopped shopping yet either.
While there are hints of seething rage and restlessness out there, in a nutshell “Hope and Change” has mostly morphed into “Mope and Complain” as “Jobs American Won’t Do” has morphed into a “new normal” of “Jobs Americans Can’t Find.”
But who are we investors to complain, what with the stock market and the bond market marching relentlessly to ever higher new highs? For the record, I am predicting that the stock market will take a hit in the month of September (“Har, good one, Jay”). Of course, for the record I also suggested that this would be a good year to “Sell in May.” Of course – also for the record – I haven’t sold a thing (I am speaking here of investments, not short term trades). The old trend-follower in me keeps whacking the side of my head and asking “what are you thinking about?”
For the record, you don’t want to know.
In the Meantime
While waiting for something to break the mind numbing doldrums presently unfolding in the markets, the focus is on shorter-term trading opportunities. In recent articles (http://tinyurl.com/mzhstm2) and (http://tinyurl.com/p4ve6z8) I talked about a simple method for attempting to play short-term bearish situations. Similar things can be done on the bullish side.
One simple method for finding potential opportunities involves:
1. Stock or ETF trading above 200-day moving average
2. Stock low price touches lower Bollinger Band (using moving average of 10 and multiplier of 2)
3. Stock subsequently exceeds high from previous trading day
4. At least a 1-day bullish divergence forms using the 3-day RSI
OK, that sounds like a lot to digest, so let’s break it down a little bit. Figure 1 – SPY trading above 200-day moving average (Courtesy: AIQ TradingExpert)
 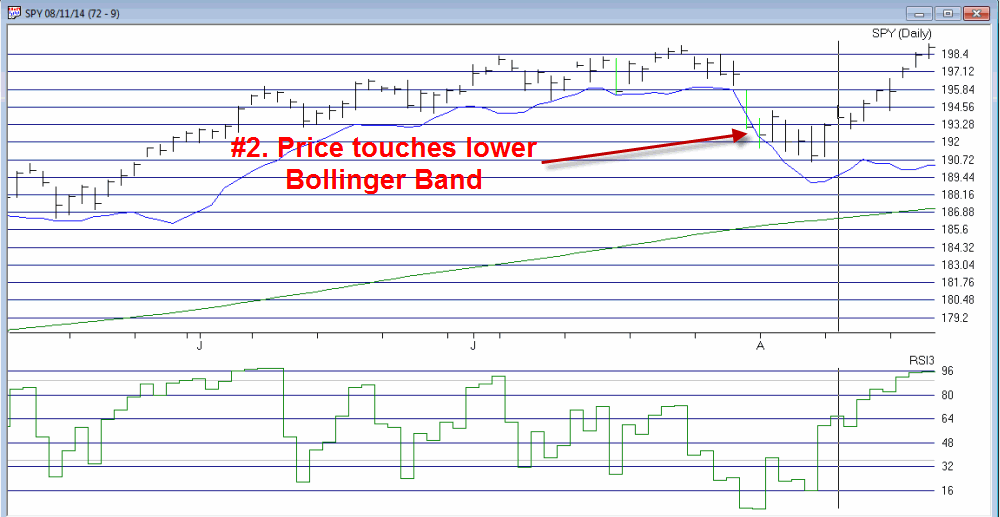 Figure 2 – SPY low price touches lower Bollinger Band (Courtesy: AIQ TradingExpert)
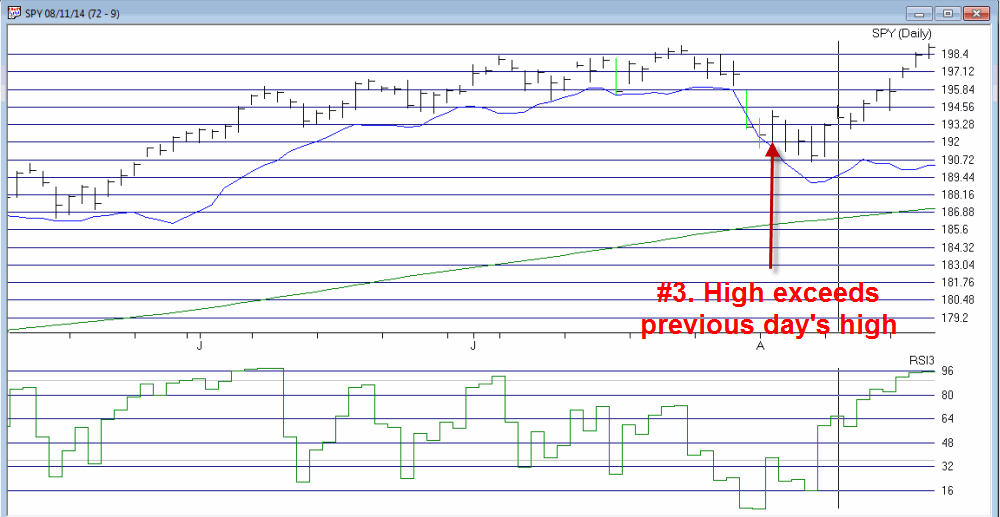 Figure 3 – SPY high exceeds previous day’s high (Courtesy: AIQ TradingExpert)
  Figure 4 – Bullish divergence using 3-day RSI (Courtesy: AIQ TradingExpert)
On 8/11 a trader might have considered buying a call option on SPY as a low dollar risk speculation on a bounce in price.
Using the “Percent to Double” routine at www.Optionsanalysis.com yields the following possibility.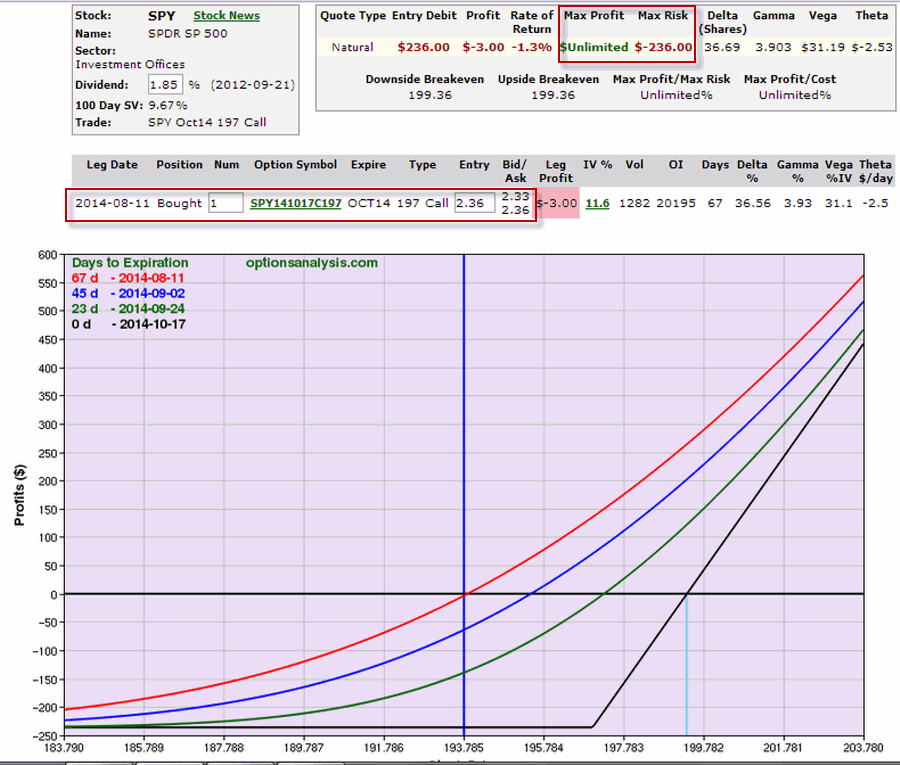 Figure 5 – Long SPY Oct 197 Call (Courtesy: www.Optionsanalysis.com)
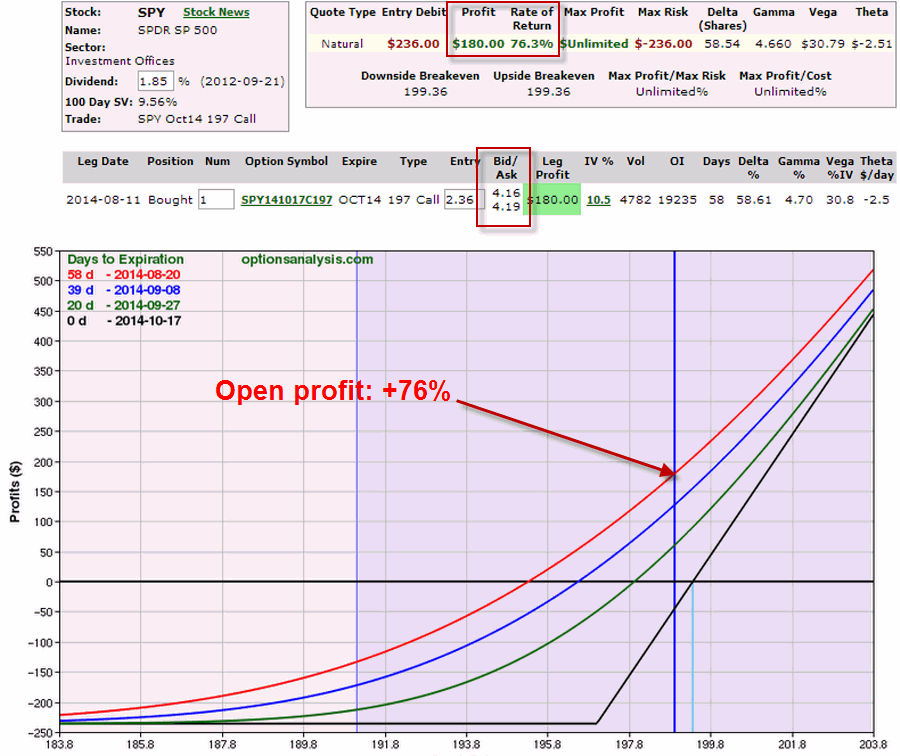 Figure 6 – Long SPY Oct 197 Call as of 8/21 (Courtesy: www.Optionsanalysis.com)
Summary
The seeming disconnect between the goings on in our little world versus the actions of the financial markets is at a level that I personally cannot recall. When something happens that you have not experienced before there is a tendency to want to “do something” – usually something very out of the ordinary – in response. But history shows that for investors and traders, developing and adhering to a well thought out trading plan – and not twisting and turning in reaction to every outside event – is the real key to long term trading success.
Which reminds me of:
Jay’s Trading Maxim #3: If you are going to develop an investment plan, you might as well make it a good one. And if you have a good trading plan, you might as well go ahead and follow it.
Jay Kaeppel
