Please note the use of the word “Play” in the title. Note also that it does NOT say “System” or “Method”, nor does it include anywhere the words “you”, “can’t” or “lose.” So what is the distinction in all of this?
The use of the word “Play” is meant to denote that this should not be considered an “investment strategy”, nor even as a “trading method”. In all candor it should basically be considered as a potential trigger or alert for traders who are willing to speculate in the market. A few relevant notes:
1. Contrary to what many will tell you, there is nothing wrong with “speculating” in the financial markets. There is a lot of money that can be made by doing so.
2. The key is in limiting the amount – and/or percentage – of capital allocated to each such trade.
3. Call and put options offer a great way to engage in this type of trading, because by their nature they allow you to “play” while using only limited sums of money.
Think about it this way. Let’s say you “get a hankerin” to take a flyer on say a rally in the bond market. Sure you could go out and buy t-bond futures contracts. As I write they are presently trading north of 138. At $1,000 a point, that means that the contract value is roughly $138,000. You only need to put up margin money of about $3,000 in order to enter the trade. Of course, if t-bonds decline from 138 to 135 then you have lost $3,000. Good times, good times.
As an alternative you might have bought a call option on the ETF ticker TLT, which tracks the long-term bond. As I write TLT is trading at $115.51, so to buy 100 shares would cost $11,551. However, a trader looking to “play” could buy say a September 115 call option for all of $182. If TLT rallied to say $118 by September expiration the 115 call would be worth $300, which would represent roughly a 65% gain. And just as importantly, on the flip side, if TLT falls apart the most the option trader could lose would be $182. Which reminds me of:
Jay’s Trading Maxim #312: If losing $182 on a trade is too much for you to bear – or will cause you great angst or to lose sleep or to beat yourself up – the “trading thing” might not be for you.
The RSI Three Strikes and You’re Out Play
So we will use the 3-day RSI indicator as a trigger to alert of a potential top. Note the use of the phrase “potential top.” Note also that nowhere do the words, “pinpoint”, “market” or “timing” appear. So here is how it works:
1. (Day x) Price and 3-day RSI make a new high for a given move.
2. (Day y) After at least one intervening down day, price makes a higher close than on Day x BUT 3-day RSI stands below its level on Day x.
3. (Day z) After at least one intervening down day, price makes a higher close than on Day y, BUT 3-day RSI stands below its level on Day y.
4. After Day z the entry trigger occurs the next time price drops below the 3 day low.
To put it another way, after Day x price makes to higher closing peaks (with at least one down day between these peaks), while RSI on Day y is below RSI on Day x and RSI on Day z is below RSI on Day y. OK, that’s as clear as mud. So let’s go the “a picture is worth 1,000 words” route.
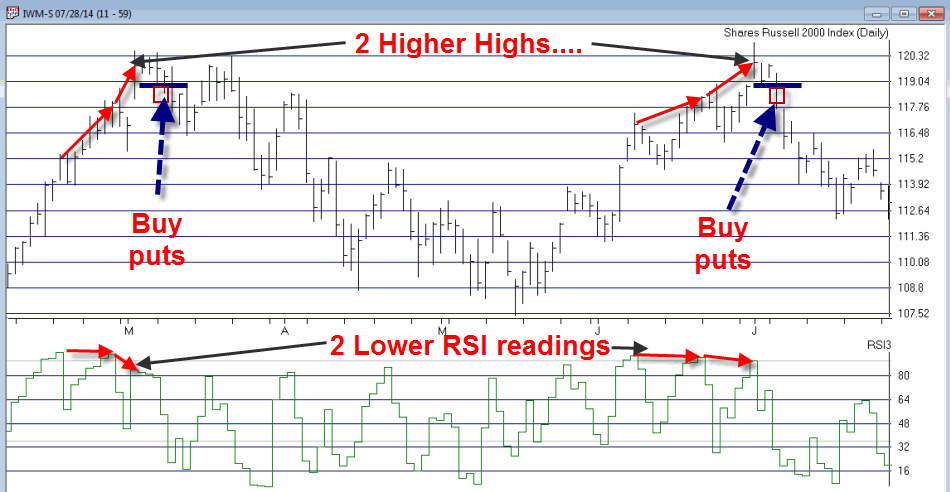
In Figure 1 you can see two examples of this “play” using ticker IWM, the ETF that tracks the Russell 2000 small cap index.  Figure 1 – The RSI 3 Strikes and You’re Out Play using IWM (Source: AIQ TradingExpert)
In both cases the same scenario plays out. Price makes two subsequent higher highs while RSI registers two subsequent lower highs. The signal to buy put options comes when price takes out the three day low.
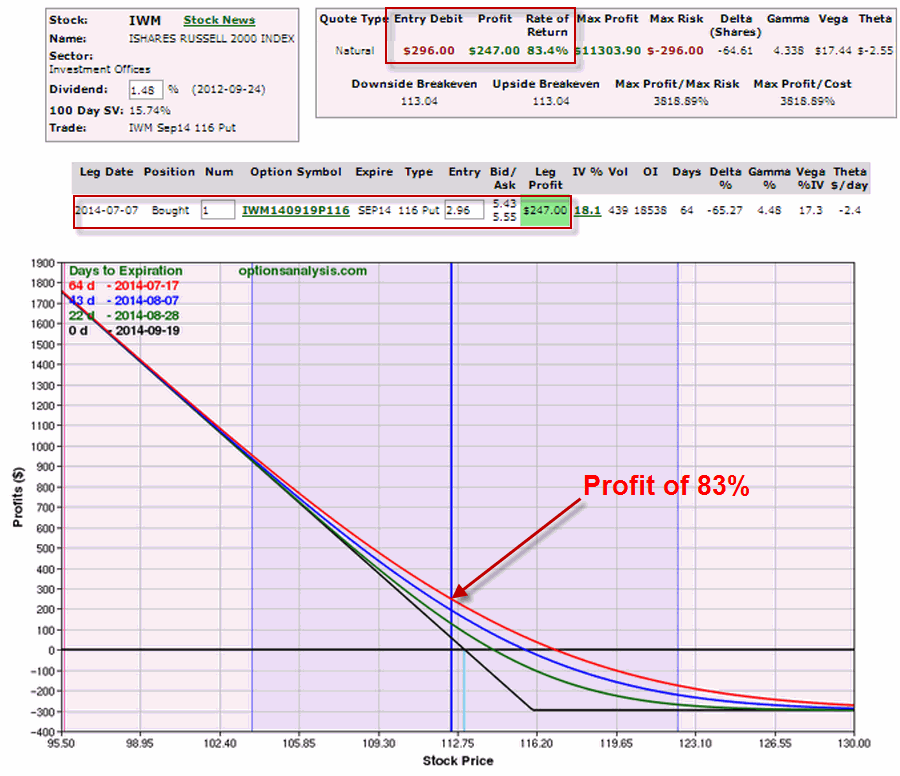
In the second example a trader could have bought a September 116 IWM put for $2.96 (or $296). Eight trading days later that put was trading at $5.43 for a profit of $83%.  Figure 2 – IWM put option using the RSI 3 Strikes and You’re Out play on IWM (Courtesy: www.OptionsAnalysis.com)
Summary
No one should get the idea that this simple “play” is the “be all, end all” of trading. I specifically have not included any ideas on when to exit this type of trade so that no one gets the idea of trying to use this as a mechanical trading system. Some traders may use a profit target, some may use an indicator, some may adjust the trade or take partial profits if a certain level of profit is reached, etc.
Like virtually any other trading idea, sometimes things will work out as hoped and sometimes they won’t. The bigger lesson is that it is OK to speculate in the markets provided you do not expose yourself to large risks. Which seems like good time to invoke:
Jay’s Trading Maxim #1: Your most important job as a trader is to make sure you are able to come back and be a trader again tomorrow.
Jay Kaeppel


Interesting set of posts. I was just testing it out using backtesting/screening to see what I could come up with. Question: do the RSI values also have to be peaks when the price highs are peaks? You just say the levels have to be lower at each subsequent peak. But the chart you show looks like the RSI levels are also peaking. Hard to tell with the arrows drawn over them. With my quick examination on my own charts, the RSI peaks don’t seem to often line up with the price peaks, but it also doesn’t seem to be a requirement. Thanks!
Matt, there is no definitive “rule” for connecting RSI peaks, this method is a bit more subjective than some others that I write about. But overall I would say that the answer is “yes”. If Point A is a high in price and a high in RSI, then Point B is a higher high in price and a lower high in RSI then point C is a still higher high in price and a peak in RSI that is below the RSI value at Point B. Yes, I would wait for RSI to decline at least one day from that lower peak before doing any trading – just to be sure that the underlying stock or ETF or whatever doesn’t just keep going to the upside. Hope that helps, Jay
Thanks! That will reduce the number of hits considerably if the RSI has to peak in conjunction with the price. Will have to give it a try.