I have been a little “quiet” lately. Kind of unusual for me, granted. But what can I say really that’s new? The stock market’s moving higher – blah, blah, blah. The bond market keeps trying to creep higher – sure, interest rates are basically 0%, so why not? Gold stocks keep trying to grind their way higher after putting in an apparent base. But who the heck ever knows about something as flighty as gold stocks?
So like I said, not much new to report.
So for the record – one more time – let me repeat where I am at:
-As a trend-follower there isn’t much choice but to say that the trend of the stock market is still “up”. So as a result, I have continued to grit my teeth and “ride”. And let’s give trend-following its due – it’s been a good ride.
-As a market “veteran” I have to say that this entire multi-year rally has just never felt “right”. In my “early years” in the market (also known as the “Hair Era” of my life) when the stock market would start to rally in the face of bad economic times I would think, “Ha, stupid market, that can’t be right.” Eventually I came to learn that the stock market knows way more than I do. And so for many years I forced myself to accept that if the stock market is moving higher in a meaningful way, then a pickup in the economy is 6 to 12 months off. As difficult as that was at times to accept, it sure worked.
Today, things seem “different”. By my calculation the stock market has now been advancing for roughly 5 years and 4 months. And the economy? Well, depending on your political leanings it is somewhere between “awful” and “doing just fine.” But in no way has the “old calculus” of “high market, booming economy 6-12 months later” applied.
Again depending on your politics leanings the reason for this lies somewhere between “it is entirely Barack Obama’s fault” to “it is entirely George Bush’s fault.” (I warned you there was nothing new to report).
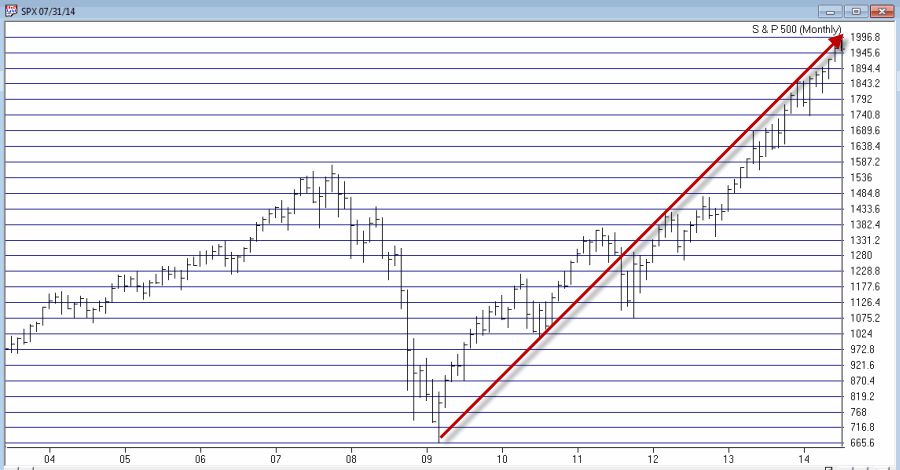
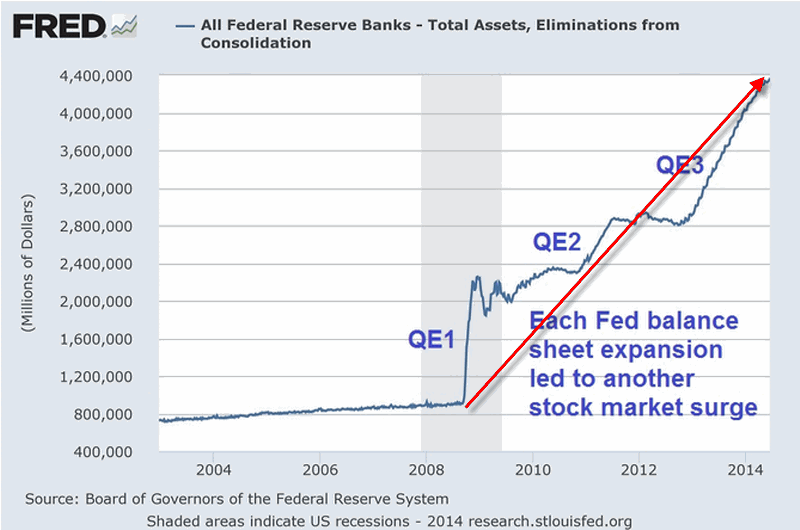
From my perspective, I think that the charts below – the second one of which I first saw presented by Tom McClellan, Editor of “The McClellan Oscillator” (which he presciently labeled at the time, “The only chart that matters right now”) – explains just about everything we need to know about the stock market actions vis a vis any economic numbers.
So take a look at the two charts below and see if anything at all jumps out at you.
 Figure 1 – S&P 500 Monthly (Source: AIQ TradingExpert)
Figure – Fed Pumping (Quantitiatve Easing “to Infinity and Beyond”) propelling the stock market
I am not a fan of using the word “manipulation” when it comes to the stock market. But I am a strong believer in the phrase “money moves the market.” The unprecedented printing of – I don’t know, is it billions of trillions of dollars – has clearly (at least in my mind) overwhelmed any “economic realities” and allowed the stock market to march endlessly – if not necessarily happily – to higher ground.
Thus my rhetorical questions for the day are:
“What would the stock market have looked like the past 5 years without this orgy of money?”
“What happens to the stock market when the Fed cannot or will not print money in this fashion?”
Because this is all unprecedented in my lifetime (as far as I can tell) I don’t have any pat answers to these questions. But I some pretty strong hunches.
My bottom line: Err on the side of caution at this time (http://tinyurl.com/p6zrqby).
Jay Kaeppel


Hi
Thanks for sharing good article,It’s solved my current needs and found best share trading tips useful to