For the record, I am now – and have for some time been – a “reluctant bull.” I can look at a dozen different things – including the fact that they economy still shows no signs of the robustness that would typically justify the run that the stock market has enjoyed in recent years – and make an argument that the stock market is way overdue to run out of steam.
But the timeless, well-worn phrase, “The Trend is Your Friend” didn’t become a timeless, well-worn phrase for nothing.
And so I continue to “ride the ride”. But as I have mentioned more frequently of late, I am keeping a close eye on the exit. Given my present “bad attitude” I tend to focus on and point out a lot more potentially bearish developments than bullish. But what the heck, I might as well let the sun shine through on occasion. So this time out, let’s highlight one development that suggests that “The End Is (Not Necessarily) Near!”
This is one of the things that has prompted me to “sit tight” and not listen to “those voices in my head” (No not those voices, the other ones…..), despite the fact that a meaningful correction could begin at any moment.
The Bullish Outside Month
Just as it takes a lot of “thrust” to get a rocket off of the ground, a large thrust upward in the stock market can be a sign that a particular rally is in the early stages rather than the late stages. So here is a pattern to consider:
A) This month’s low is less than or equal to last month’s low
B) This month’s close is greater than last month’s high
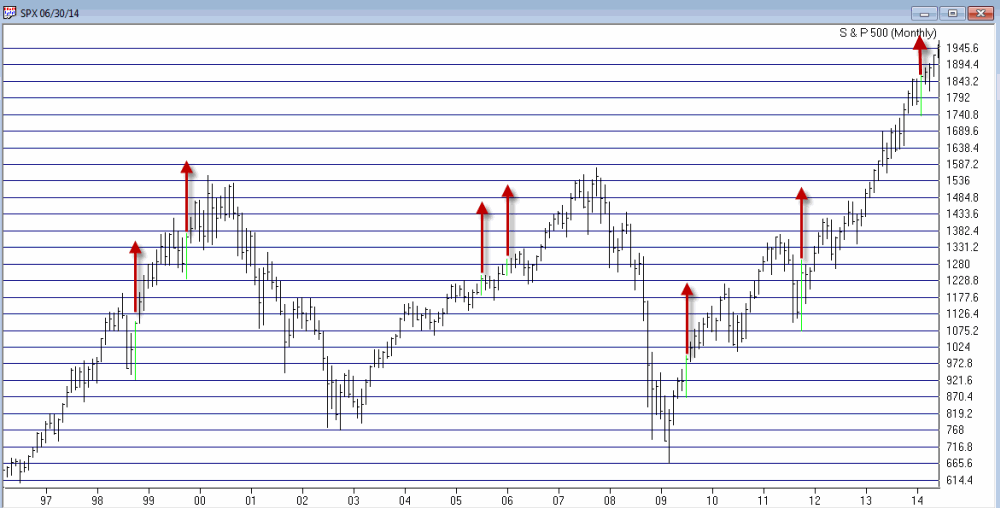
That’s it. In Figure 1 we see the S&P 500 monthly bar chart from 1996 to the present with these “Bullish Outside Months” highlighted in green. The first one occurred in October 1998 and launched the final surge in great bull market of the 1990’s (or as most of us above a certain age refer to it – “The Good Old Days”). 
Figure 1 – Bullish Outside Months for SPX since 1996
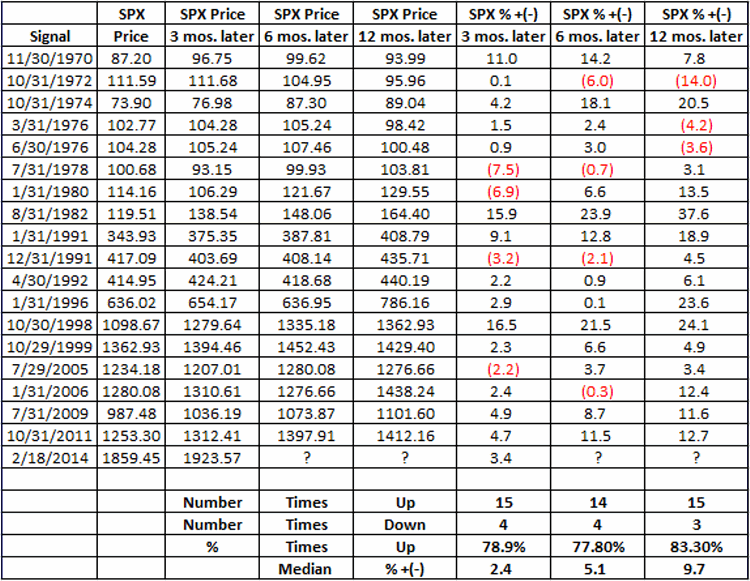
The most recent signal occurred at the end of February of this year. This was only the 19th signal since 1970. The action of the S&P 500 index following previous signals – looking out 3 months, 6 months and 12 months after each signal – appears in Figure 2.  Figure 2 – SPX Results 3, 6 and 12 months after Bullish Outside Months (1970-Present)
As you can see, on a 3-month, 6-month and 12-month basis, the S&P 500 has been higher at least 77% of the time following previous signals. Which creates something on a conundrum.
Summary
In my mind’s eye the stock market is ridiculously overbought and “due” for a good solid “whack” sometime between now and the end of September. But this particular indicator suggests that that “whack” may not come. So for now my own primary investment strategy remains to play the long side of the market unless and until the major averages (Dow, SPX, Nasdaq 100 and Russell 2000) drop below their respective 200-day moving averages. Fairly boring yes, but it pays to mind:
Jay’s Trading Maxim #72: Boring and effective is much better than exciting and AAAAAHHHHHH!!
Jay Kaeppel

