…and down will come, well just about everything, as far as I can tell.
OK, for the record maybe it should say “If the Dow Breaks.” After all I am still firmly ensconced here at “Camp Bull.” I would like to attribute this to disciplined nerves of steel, but it would be an understatement to say that that would be an overstatement. The truth is my crystal ball broke a very long time ago (sadly I continued believing what it portended for a long time before I realized it was actually broken). So I have long since held dual citizenship in “Camp Trend Follower”.
But I have got be honest…..I am feeling the urge to run like a sissy through the woods to “Camp Yikes”.
The Overall Market
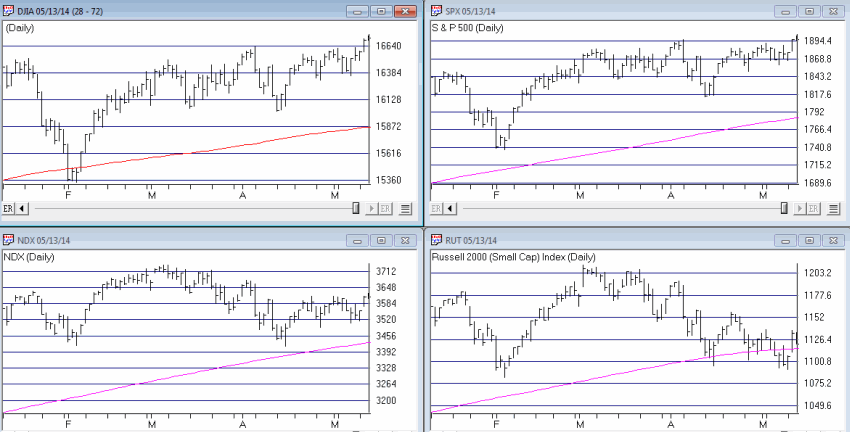
Defining the “overall” market is something of a crapshoot these days, as some of the “overall” market seems to be going one way and another part of the “overall” market seems to be going another way. In Figure 1 we see the Dow, the S&P 500, the Nasdaq 100 and the Russell 2000.  Figure 1 – The Four Major Averages with 200-day moving averages
In a nutshell, the “Generals” are still marching but the “Troops” are in retreat. Now every market pundit seems to be offering up their opinion as to whether the “Generals” will ultimately lead the troops higher or the other way around. With my crystal ball still out of order I must unfortunately go with my stock answer here of “it beats the heck out me.” And “hey things are swell here at Camp Bull.” But I have been around this business long enough to remember several instance where the “Troops” led the way (1984, 1987, 1990, 2000, 2008) and the “Generals” followed. So we’ll see what we see.
OK, just in case that little segment was not foreboding enough, let’s get to the really “scary” part.
Sectors Suck in Summer (during Mid-term years)
One caveat before I even launch, the sample size of what I am about to detail is very small (6 calendar years each four years apart starting in 1990). Also, that’s the good news. As a “seasonalaholic” (“Hi, my name is Jay”) I am acutely aware of the following facts:
1. The market tends to perform better between the end of October and the third trading day of the following May than it does from the third trading day of May through the end of October (also known as “Where We Are Now.”)
2. This is a mid-term election year.
I also do a lot of work with sectors and sector funds as I have found that investing at the right sector at the right time is – all kidding aside – one heck of a great way to invest.
So I was curious as to which sectors tended to perform the best during the May to October period during mid-term election years. Here is the short list:
Health Care. Period.
Everything else. Well on a buy in May and sell in October basis – let’s just say it isn’t pretty. So here is the test I ran:
Tracking the growth of $1,000 invested in each Fidelity Select Sector fund only:
*Between the close of May trading day 3 and the end of September (for the record, October tends to be an OK month during mid-term election years – more on this topic in a future article) during each mid-term election year.
The results appear below in Figure 2. If you are squimish you might want to brace yourself.
|
Fund |
%+(-) |
|
FBIOX |
(12.1) |
|
FBMPX |
(34.5) |
|
FBSOX |
(36.9) |
|
FCYIX |
(28.8) |
|
FDCPX |
(42.4) |
|
FDFAX |
(3.7) |
|
FDLSX |
(45.9) |
|
FIDSX |
(55.9) |
|
FNARX |
(35.4) |
|
FPHAX |
(18.6) |
|
FSAGX |
(1.6) |
|
FSAIX |
(65.7) |
|
FSAVX |
(71.4) |
|
FSCGX |
(58.9) |
|
FSCHX |
(49.7) |
|
FSCPX |
(31.2) |
|
FSCSX |
(35.9) |
|
FSDAX |
(62.7) |
|
FSDCX |
(38.2) |
|
FSDPX |
(57.5) |
|
FSELX |
(71.0) |
|
FSENX |
(42.9) |
|
FSESX |
(65.3) |
|
FSHCX |
(20.1) |
|
FSHOX |
(79.1) |
|
FSLBX |
(59.1) |
|
FSLEX |
(49.6) |
|
FSMEX |
(12.0) |
|
FSNGX |
(47.5) |
|
FSPCX |
(27.2) |
|
FSPHX |
41.6 |
|
FSPTX |
(42.0) |
|
FSRBX |
(59.5) |
|
FRESX |
(26.4) |
|
FSRFX |
(61.2) |
|
FSRPX |
(43.8) |
|
FSTCX |
(35.4) |
|
FSUTX |
(12.1) |
|
FSVLX |
(59.1) |
|
FWRLX |
(32.8) |
|
FNARX |
(35.4) |
Figure 2 – Net %+(-) invested only between 3rd trading day of May and last trading day of September during mid-term election years (1990 , 1994, 1998, 2002, 2006, 2010, 2014)
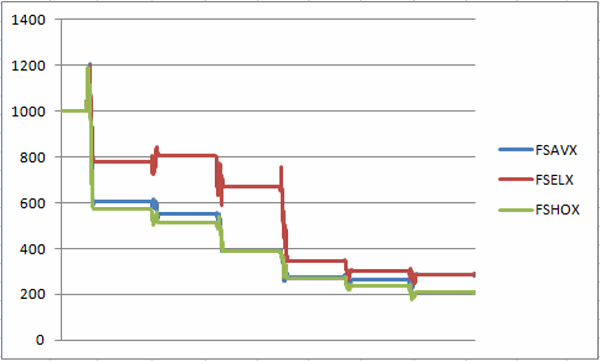
Anyone notice a trend? To see just how bad things can be, once you are able to work yourself back up out of the fetus position, take a glance at Figure 3, which shows the three worst performers during the May-Sep mid-term year period – FSAIX (-71%), FSELX (-71%) and FSHOX (-79%). Figure 3 – FSAIX, FSELX, FSHOX – growth of $1,000 May through Sep of mid-term election years (1988-present)
Now I have an obvious flare for the obvious (which I think should be pretty obvious – also I tend to repeat myself) but I am not even going to comment on Figures 2 and 3.
The Good News
The one mistake you should not make based on looking at these numbers and charts is to assume that it is not possible to make money in sector funds between May and September of mid-term years. It just requires something better than a buy and hold approach. Several momentum systems and seasonal plays that I have developed over the years have still managed to show some pretty good gains historically “among the ruins” of midterm election summer months.
But if you’re gonna play, you’d better bring your “A” game.
Summary
Repeating now – I am still in “Camp Bullish.” And ideally I’d like to spend the summer. There seems to be a lot of fear and loathing among the “crowd” that I follow regarding the stock market. Typically that’s a good thing and suggests that the stock market just might surprise everyone this time around. And I hope that it does.
But I will be keeping a pretty close eye on my “camp mates” in the days and week ahead. Any sign of “trouble” (i.e., Dow, S&P breaking below 200-day moving averages) and they are going to have to send a search party out to find me……
Jay Kaeppel


One thought on “When the Dow Breaks, the Sectors will Fall….”
Comments are closed.