For better or worse, some people are just market “junkies” (Hi, my name is Jay). Stocks, options, futures, ETFs, sure, whatever. Bring it on. Hey why not throw some FOREX in there too (just to make my head hurt as I try or the umpteenth time to wrap my head around currency conversions)? Bottom line, whatever it is, as long as it relates to the financial markets, we’re interested.
But not everyone is like this (Or so I’m told). Some people like to put their money into something and just kind of leave it there and let it grow over time. And as I avert my eyes momentarily from a quote screen I can see that this approach has a certain simple elegance to it. So today, let’s touch on a simple strategy “for the other half” (or as they are more commonly known outside of “market junkie” circles – “normal people”).
Growth & Income
For most “normal people” there are basically two ways to make money in the financial markets – buy something and watch it grow in value and sell it later at a profit, and/or invest in something that pays interest and or dividends along the way, thus generating a potential “stream of income.”
A lot of investors also combine the two concepts and invest in things that not only can “grow” but which can also generate “income.” (The mutual fund industry figured this out a long time ago and sometime during the 1980’s helpfully launched approximately 12,356 mutual funds titled “[Mutual Fund Family Name Here] Growth & Income Fund.” )
So sure that’s one way to go. Here is another.
Utilities & Intermediate-Term Government Bonds
Lots of people buy utility stocks because they tend to pay a higher dividend yield than the average stock. Likewise, during bull markets they tend to go up in price. Additionally, lots of people buy intermediate-term U.S. government bonds because they are considered “safe” in terms of payment of principal and interest (although since they are issued by the largest debtor in the history of this particular planet, I suppose it can be argued that, “I do not think that word means what you think if means”). In any event, a lot of people do it. So let’s look at a simple strategy that combines the two ideas.
Jay’s Growth & Income System
Here are the rules:
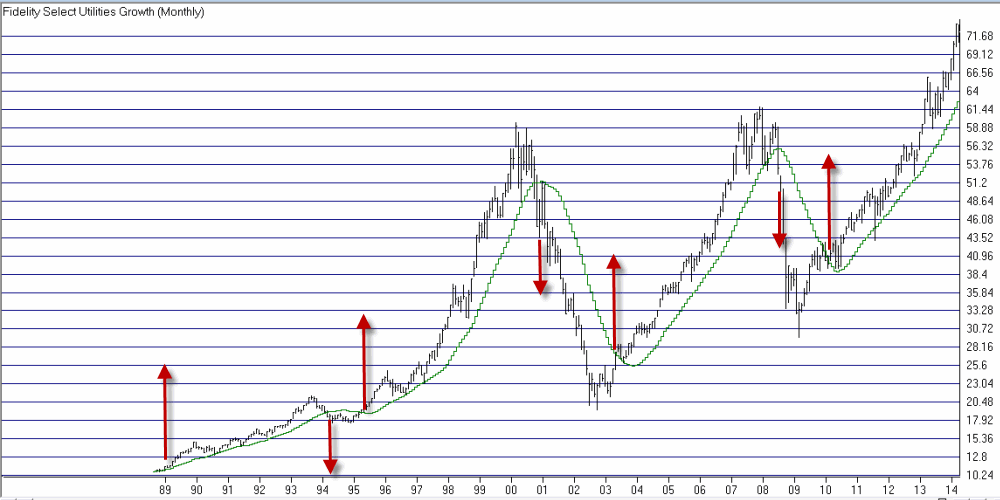
1) If Fidelity Select Utilities Growth (ticker FSUTX) closes the end of the month above its 21-month moving average (of monthly closing prices), buy and/or continue to hold utility stocks.
2) If Fidelity Select Utilities Growth (ticker FSUTX) closes below its 21-month moving average (of monthly closing prices) for two consecutive months, then sell utility stocks and buy intermediate-term government bonds.
3) Repeat.
Starting at the end of 1988, there have been 3 full round turns (buying and selling utility stocks) and the “system” is still holding long utility stocks on the 4th round turn. Figure 1 – Jay’s Growth & Income System Buy and Sell Signals (Chart courtesy of AIQ TradingExpert)
Results
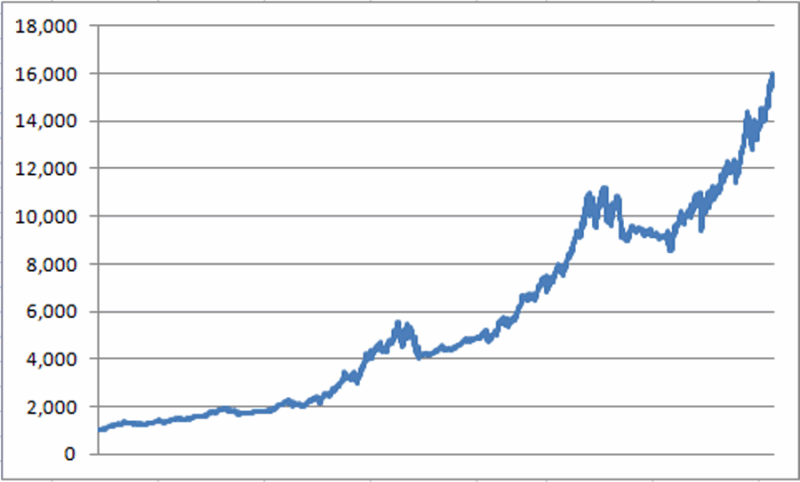
For the record, the results that appear in Figures 2 and 3 reflect the gain or loss achieved by switching between Fidelity Select Utilities Growth (ticker FSUTX) and Fidelity Government Income (ticker FGOVX). The results do not include any dividends paid by these funds along the way.  Figure 2 – Growth of $1,000 (12/31/88 – 4/17/14)
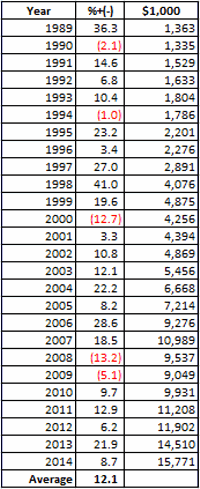
Figure 3 – Annual Results
Note that the system is by no means without risks. There were 5 calendar years that witnessed a loss (including a worst of -13.2% in 2008). Still, for better or worse, the average annual gain (not including fund dividends paid) was 12.1%.
Summary
Maybe 12.1% a year (plus dividends) floats your boat and maybe it doesn’t. That’s for each investor to decide for themselves. The real point of this particular article is not to convince you to utilize the method I have highlighted. The real point is simply to illustrate the fact that there are some pretty simple methods out there that can allow “normal people” (and I think you know who you are) to generate some relatively steady rates of returns without fixating on every gyration of the stock or bond market.
Now if you will excuse me, I think the EuroYen just moved two pips…
Jay Kaeppel


This strategy would probably have a much better return than you note if dividends were included. And utility dividends/government bond interest would be expected to be higher than S&P 500 dividends. Still, even without dividends, it is a nice and simple strategy that has high returns with tolerable drawdowns relative to a benchmark like the S&P 500. As for the 5 negative years, with the exception of 2009, all those years were not good years for stocks in general, so the strategy still outperformed even though it was down. Because of the lag in the moving average relative to the fund’s price, the performance of 2009 seems to have been negatively impacted. Indeed, because of such lag and given the asymmetry of markets where faster turns occur at market bottoms, one could consider a different criteria for entry (or at least partial entry) into the utility fund when price is (well) below the moving average, such as using a Coppock or merely price moving above the most recent high (which from visual inspection of the chart above, seems to get you into utilities earlier). Thanks for sharing.
Very interesting. Easy to follow and the results speak for themselves. I think if you’re a growth and income investor, 12% CAGR should be acceptable. The one thing I would struggle with is the -5.1% in 2009. I’d be curious to know what the max drawdown was as well. Maybe if this was paired with some of the other more growth and income sectors like financials and/or consumer staples how would the results look? Or what about using something like the Dividends Achievers Index or something similar? Great as usual, Jay. A great starting point for further exploring.
Why make it so complicated? The simplest strategy on buying and selling FSUTX when it crosses the 10 month SMA, and holding FGOVX when FSUTX is not held, leads to following returns with CAGR of 13.8% and maximum drawdown of 16%.
1998 33.64%
1999 25.96%
2000 -1.85%
2001 6.65%
2002 11.47%
2003 21.19%
2004 24.21%
2005 9.34%
2006 30.09%
2007 14.20%
2008 -6.80%
2009 15.18%
2010 6.63%
2011 8.78%
2012 4.26%
2013 20.65%
2014 9.98%
Awesome! I like simpler. One “logistical” issue to consider, however, is is: Fidelity has gotten fairly militant with switching restrictions of late. In 2000, the 10-month MA method you’ve devised (if I am seeing it right) wold have switched 4 months in a row and 5 times in 6 months. My guess is that if yo tried to do that now with FSUTX and FGOVX they wold have a problem with it. A person should find out for sure before actually implementing the strategy to avoid any nasty surprises later. there are other utility and IT government bond funds and ETFs that might work in its place. Thanks for your (excellent) idea. Jay
You can easily add the constraint that no holding period is less than 60 days. Here are the extended results.
1991 21.10%
1992 10.63%
1993 13.15%
1994 -5.11%
1995 31.70%
1996 8.59%
1997 30.31%
1998 20.31%
1999 25.96%
2000 8.85%
2001 6.65%
2002 11.47%
2003 21.19%
2004 24.21%
2005 9.34%
2006 30.09%
2007 6.84%
2008 -6.80%
2009 15.18%
2010 6.46%
2011 13.09%
2012 7.02%
2013 20.65%
2014 9.98%
CAGR 13.5%
There are nine entries and exits during this period,
Pretty good. I think that VUSTX/TLT instead of FGOVX will yield even better overall results.
Very nice.
Will it work as nicely with a 90-day hold on FSUTX?
Thanks!
Joel, so far there have been no instance where the trend reversed within 90 days. Obviously that can change. My best suggestion if a buy signal was followed by a sell signal within 90 days would be to sell half or more (as I understand it there would not be any fees or futures switching restrictions if some money is still in FSUTX) and then sell the rest after 90 days (assuming there is not another buy signal by then). I would suggest you double check with Fidelity on this just to be sure, though. Jay