I haven’t written anything in a while as I have been off at an “undisclosed location” on “important” business (Oh, which reminds me, Mickey and Minnie say “Hi”). Anyway, last time out I touched on a “simple” indicator. Please note that I did not say “World Beater” indicator, and the words “you can’t lose” never passed from my lips, er, fingertips in this case. But there is something about “simple” that can often be very “useful” when it comes to trading.
So while all eyes remains focused on the stock market as traders wonder “will it or won’t it?”, let’s turn our attention to the bond market.
A Simple Method for Bonds
In last week’s article (http://jayonthemarkets.com/2014/03/30/a-simple-buy-signal-for-traders/) I wrote about a simple method for using the Commodity Channel Index (or CCI for short).
In an article dated 9/8/13 (http://jayonthemarkets.com/2013/09/08/t-bonds-and-japanese-stocks-inversely/) I wrote about the fact that (for whatever reason) t-bonds tend to move inversely to Japanese stocks. So this time out let’s combine the two ideas as follows:
-If the 25-day moving average for ticker EWJ (ETF that tracks Japanese stocks) is below the 150-day moving average we will look for bullish signals on ticker TLT (ETF that tracks the long treasury bond) when the CCI drops below -100 and then turns up for one day.
-If the 25-day moving average for ticker EWJ (ETF that tracks Japanese stocks) is above the 150-day moving average we will look for bearish signals on ticker TLT (ETF that tracks the long treasury bond) when the CCI rises above +100 and then turns down for one day.
Did I mention this was “easy?”
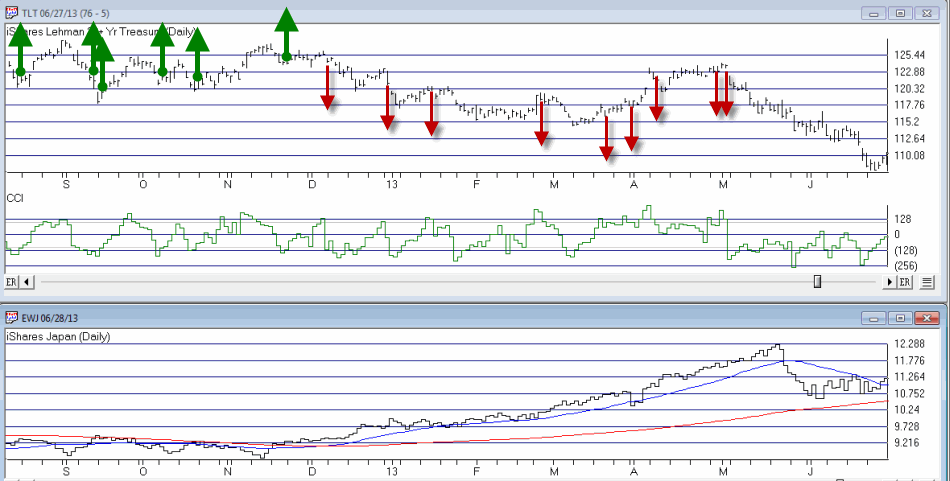
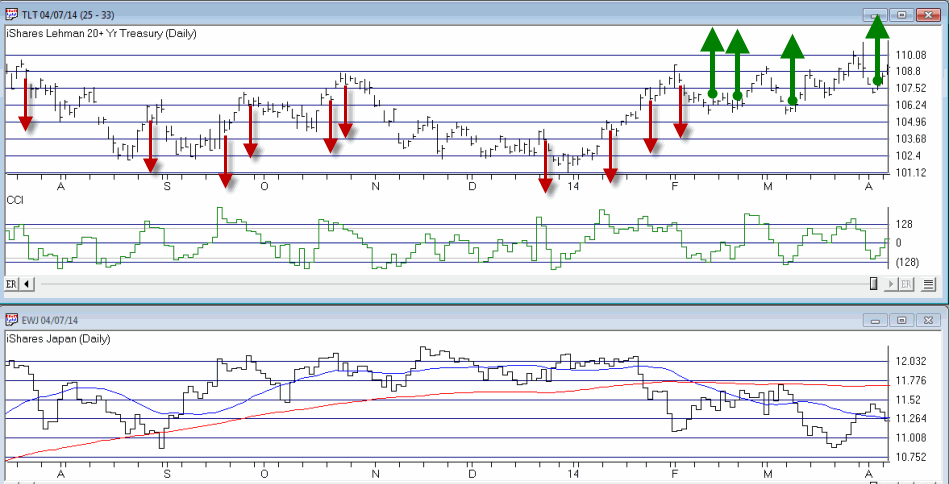
So how does it look just eyeballing things? Not too bad as you can see in Figures 1 and 2. In both of these charts, ticker EWJ appears on the bottom with the 25 and 150 day moving averages plotted. Remember, when EWJ is in a downtrend we are looking for bond buying opportunities and vice versa.
The down red arrows on the TLT chart highlight potential shorting opportunities and the green up arrows highlight potential buying opportunities.  Figure 1 – TLT on Top, EWJ on the bottom (Courtesy: AIQ TradingExpert)
  Figure 2 – TLT on Top, EWJ on the bottom (Courtesy: AIQ TradingExpert)
Trading It with Options
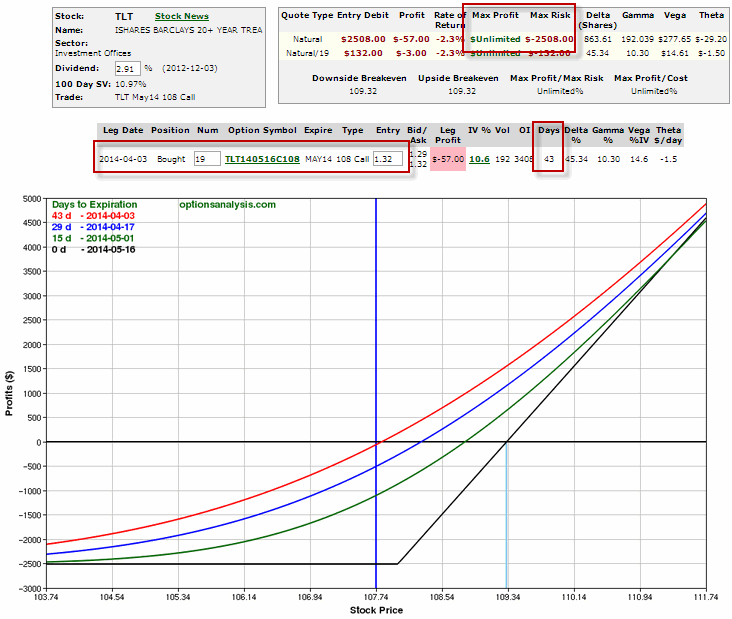
You didn’t think I was going to get through this without mentioning options did you? To look at one possible way to play this method, let’s just look at the last buy signal that occurred at the end of Figure 2 on 4/3/14.
Let’s consider buying the call option with at least 40 days left until expiration and the highest gamma among call options for that expiration. A trader willing to risk roughly $2,500 could have bought 19 of the May 108 TLT calls with 43 days left until option expiration as shown in Figure 3.  Figure 3 – Long 19 TLT May 108 Calls (Courtesy: www.OptionsAnalysis.com)
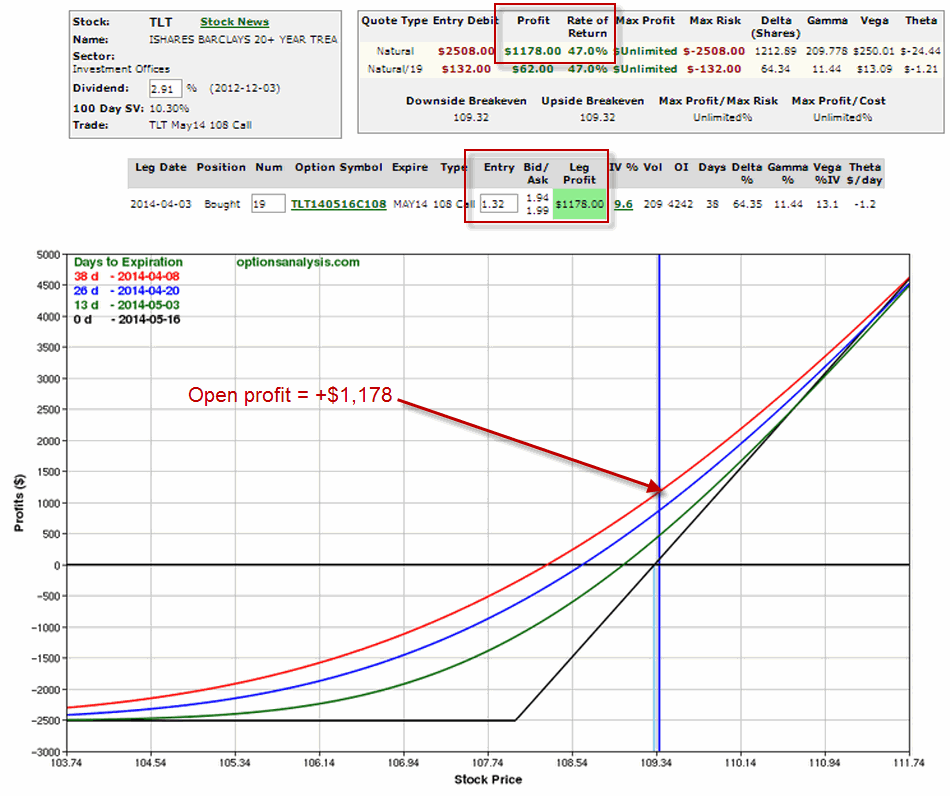
Over the course of the following three trading days ticker TLT rose from 107.74 to 109.37 (or +1.5%). During the same time the TLT May 108 call rose from $1.32 to $1.94 (or +47%) and the trade shows an open profit of +$1,178.  Figure 4 – Long 19 TLT May 108 Calls (Courtesy: www.OptionsAnalysis.com)
What to do with this trade from here is a whole other topic.
Summary
So is the simple system displayed in Figure 1 and 2 the greatest thing since sliced bread? And is it guaranteed to crank out an endless string of trades like the one shown in Figures 3 and 4?
No and No (sadly).
Still, it sure is simple, no?
Jay Kaeppel

