Like a lot of people who have been in this business a long time, I have reached a point where I hardly ever find two numbers that I don’t want to multiply, divide, or compare the relative strength of. In fact, one of the easiest traps for us “market analyst” types to fall into is to think that the more numbers we crunch and the more indicators we analyze, the better.
In the immortal words of whoever said it first, “tain’t necessarily so.”
So let’s look at something “simple” that we can use as a “catalyst”.
MACD as a Trading Catalyst
MACD – an indicator developed by a gentleman named Gerald Appel back in what I longingly refer to as the “Hair Era” in my life – has long been a favorite of traders. And for good reason as there are many varying applications. We will focus on one.
*We will look at 4 tickers – SPY, QQQ, IWM and DIA, which are ETFs that track the S&P 500, Nasdaq 100, Russell 2000 and Dow Industrials, respectively.
*For each ticker we will look daily at the MACD indicator using the standard default values of 12-26-9.
*What we are looking for is for the MACD histogram value to drop below 0 for at least two consecutive days and then reverse to the upside immediately after declining for at least two consecutive days. (AIQ Expert Design Studio Code is pasted at end of article).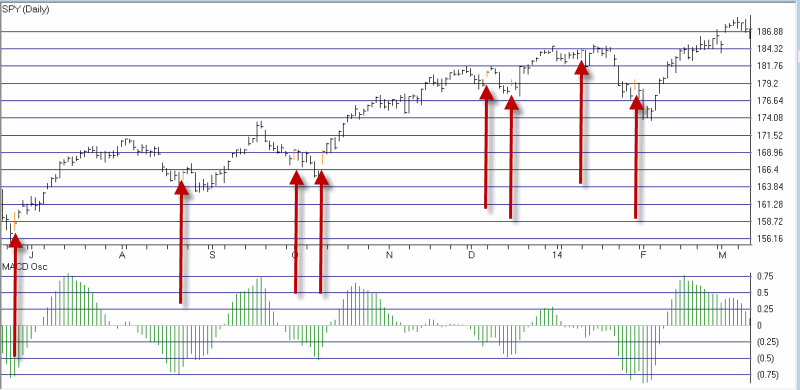 Figure 1 – MACD RevUp Signals on ticker SPY
*When two or more of the four tickers give a signal within a day or two, we can look at this as a “buy signal”.
In Figure 2 you see charts of the four tickers with “signal days” highlighted in orange. 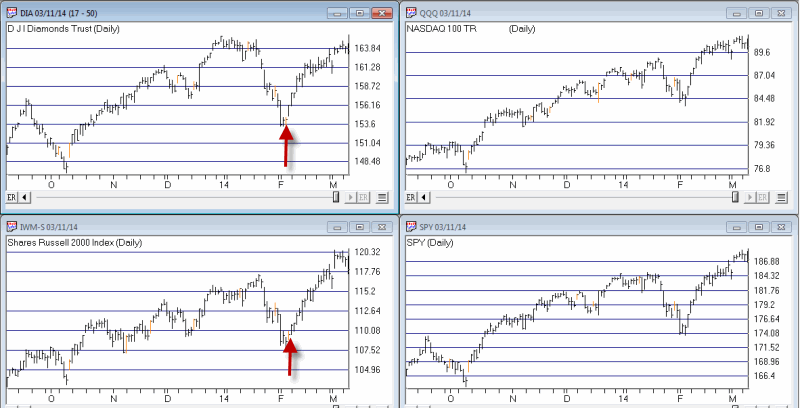 Figure 2 – Four Index ETFs with Daily MACD Buy Signals (Courtesy: AIQ TradingExpert)
The most recent “buy signal” (was on 2/6/14, which obviously was followed by a great rally. Of course, the previous signal on 1/10/14 (DIA and SPY) was followed by a sharp decline in late January before a subsequent rally. So no one should get the idea that any given signal is a “sure thing.”
Recent signals (see Simple Exit Rule below):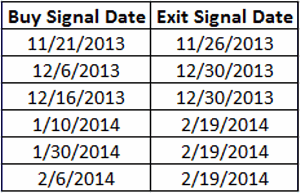
One other interesting thing to note however is that these signals can also be generated using weekly charts as displayed in Figure 3.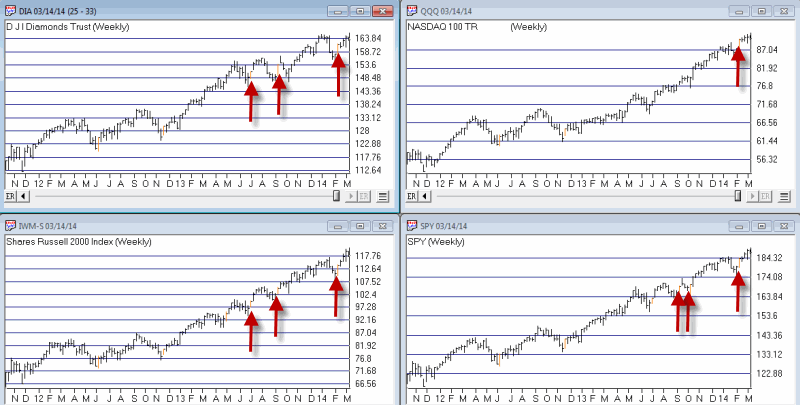 Figure 3 – Four Index ETFs with Weekly MACD Buy Signals (Courtesy: AIQ TradingExpert)
Recent buy signals using weekly charts occurred on 2/14/14. 9/13/13 and 7/5/13, all of which were pretty good times to be looking at the long side of the market.
Using the Signals
In the interest of “keepin it simple”, perhaps the easiest way to play a “buy signal” from this “system” (such as it is) would be to buy call option on a stock index. For this we turn to the “Percent to Double” routine at www.OptionsAnalysis.com and run a test on call options on the major stock indexes. The input screen appears in Figure 4.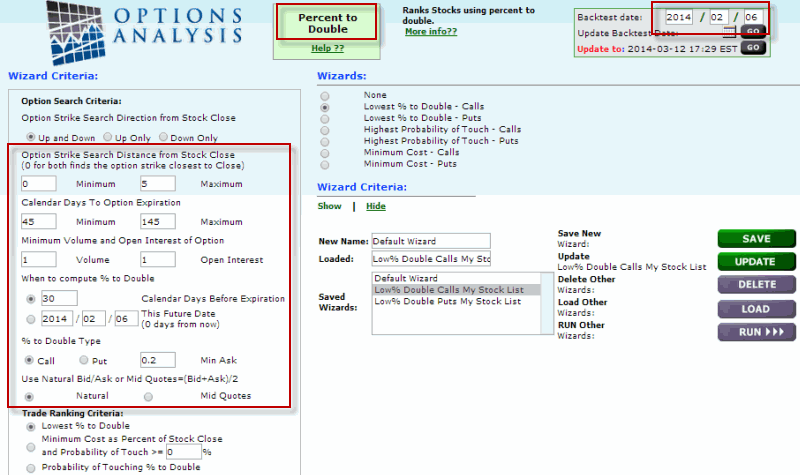 Figure 4 – Percent to Double Input Screen (Source: www.OptionsAnalysis.com)
From the output list I skipped several DIA call options and selected the first SPY call option on the output list. The simple reason is that the SPY option had greater volume, greater open interest and a tighter bid/ask spread. That position appears in Figure 5. 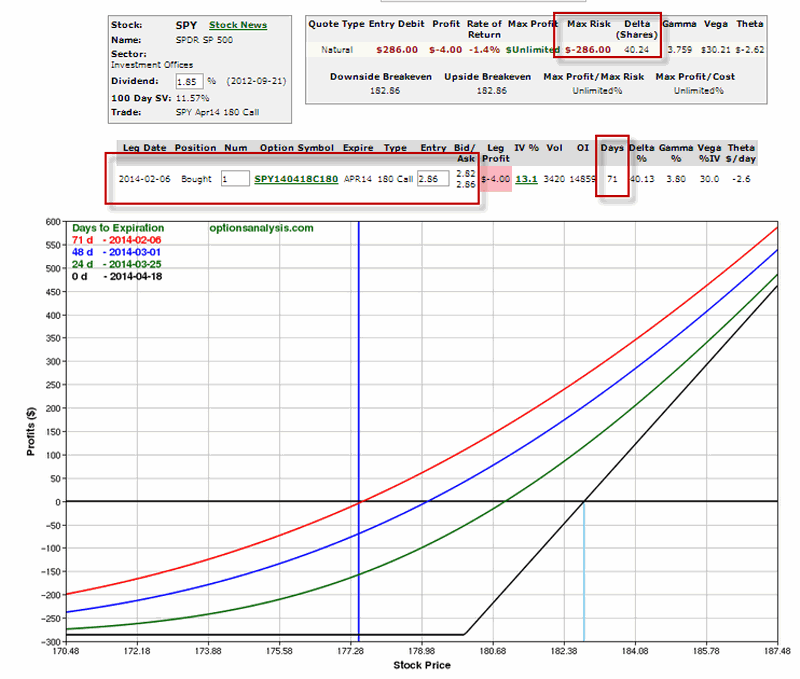 Figure 5 – SPY April 180 Call Trade (Source: www.OptionsAnalysis.com)
Our “Simple” Exit Rule
How to manage the trade after it is entered is a topic that could fill several volumes. But since we are focusing here on “simple” methods – when the MACD oscillator tops out and declines for one day we will exit the trade.
For our example trade this occurred on 2/19/14. At this point the April SPY 180 call had advanced from $2.86 to $5.44, or +90% as shown in Figure 6. 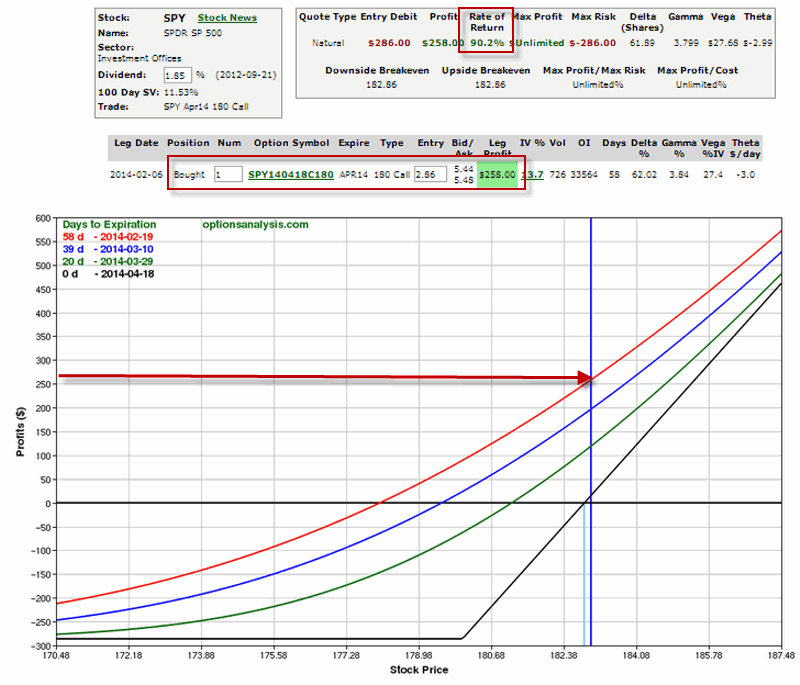 Figure 6 – SPY April 180 Call Trade (Source: www.OptionsAnalysis.com)
Summary
So is this the “World Beater System” that should cause everyone to forget what they are using now. Hardly. But for a “simple” set of steps the potential is there to generate some useful trading signals. As always, traders interested in this type of trading need to do some homework before adopting any new type of trading approach.
Jay Kaeppel
AIQ Expert Design Studio Code =
MACDRevUp if [MACD Osc]>val([MACD Osc],1) and val([MACD Osc],1)<val([MACD Osc],2) and val([MACD Osc],2)<val([MACD Osc],3) and val([MACD Osc],2)<0.


is it possibe to get the code for TOS – thinscripte code
AIQ Expert Design Studio Code =
MACDRevUp if [MACD Osc]>val([MACD Osc],1) and val([MACD Osc],1)<val([MACD Osc],2) and val([MACD Osc],2)<val([MACD Osc],3) and val([MACD Osc],2)<0.ible to get the code for TOS
Um, not from me, sorry. I am not familiar TOS – thinscripte code. Sorry.
Please let me know should the price reverse to the upside…… or the macd histogram to reverse
MACD histogram value to drop below 0 for at least two consecutive days and then reverse to the upside immediately after declining for at least two consecutive days