Monthly Archives: March 2014

A Simple Buy Signal for Traders

If there is one thing I have learned about trading over the years it is that there sure are a lot of ways to play.  I mean there are literally thousands of stocks, bonds, funds, ETFs, options, FOREX, and so and so forth to choose from.  From there a trader can analyze roughly a bazillion (give or take) different indicators, oscillators, trend following methods, fundamental factors, etc., etc.

No wonder people get confused and no wonder there is a tendency for a trader to “try” one method for “a while” and as soon as that one isn’t faring as well as something else they’ve heard about, well, that trader to move on to another method (you know who you are).

And then of course there are the pundits, you know wise guys like me who like to imply that they know everything there is to know about trading.  And so traders sometimes feel compelled to listen to someone else if they assume that that person knows more about trading than them.  The paradox here is that is that – as with any endeavor – it does make sense to listen people with more knowledge than you on  given topic in order to learn things.  But trading is a little trickier.  So this seems like a good time to invoke:

Jay’s Trading Maxim #215: Whenever you hear someone say “In order to be successful in the markets you must……”, what they really should be saying is “In order for me to be successful in the market I must…..what you must do may be something completely different.”

In other words you need to take in a lot of information and then go through the painstaking process of stripping away about 90% of what you’ve been told and boil it down to just that which allows you to be successful.  And whatever anyone else does is not relevant. 

Buy the way it is not an easy process. 

One other suggestion:

Jay’s Trading Maxim #218: Once you settle on a trading plan/method, DO NOT TINKER with it day in and day out.  Revisit your trading plan/method a few times a year and see if you’ve learned anything that can add value.  Otherwise “Trade, don’t Tinker.”

A Simple Signal

So all of that being said, I still can’t fight the urge to be a wise guy and offer up a simple “buy signal” using the Commodity Channel Index (or CCI).  Now please not that there is no inference made that this is the “be all, end all” of trading.  In fact, it really is only useful (I have found) for very short-term trading and for traders who are diligent about cutting losses.  In other words if you have a recent history of buying something and then when it came time to cut a loss you said “Well, I’ll just give it a little while longer to see what happens”, then beware.

So any way here goes.  If:  

-SPY > 200-day moving average

-CCI drops to -90 or below and then turns up for one day

-then the next time SPY takes out the previous day’s high enter a long position

BUT WAIT!  Before you even think about trying to use this idea note that you will need to develop some profit-taking and stop-loss criteria.  One place to start would be to exit on the first profitable close.  In other words, yes it can be that short-term in nature.  If that is not your “cup of tea” you need to either, a) figure out a different way to use the idea, or b) ruthlessly discard it along with the 90% of ideas that you encounter that do you absolutely no good.

Again, there is no inference made that every new signal equates to “Happy Days are Here Again!”  What I have described simply signals that maybe, just maybe the market will follow through at least a little bit to the upside.  Do not read more into it than that.

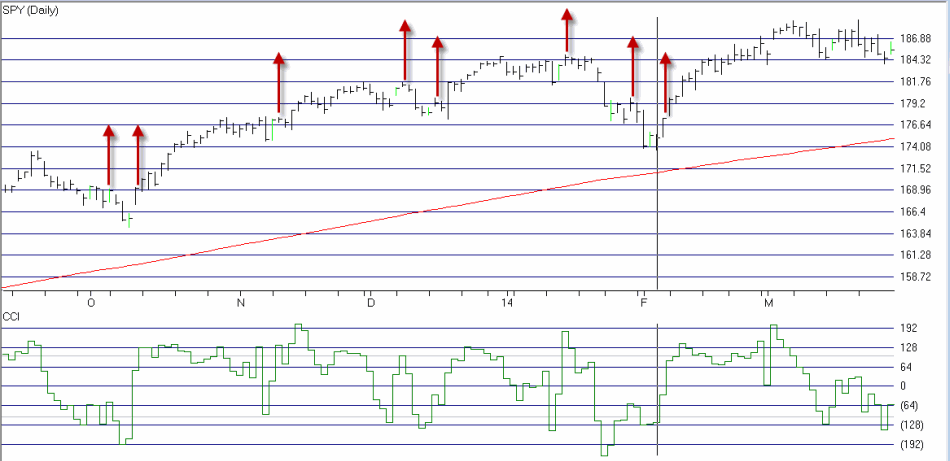
In Figures 1 and 2 below, the green bars highlight days when CCI trend up from -90 or below while SPY was above its 200-day moving average. The red arrows highlight the next time SPY took out the previous day’s high.  The key thing to note is that sometimes there is follow through and sometimes there is not. 

It is how you deal with the “sometimes there is not” occasions that matters the most.jotm20140330-01Figure 1 – SPY 2013-2014  (Courtesty: AIQ TradingExpert)
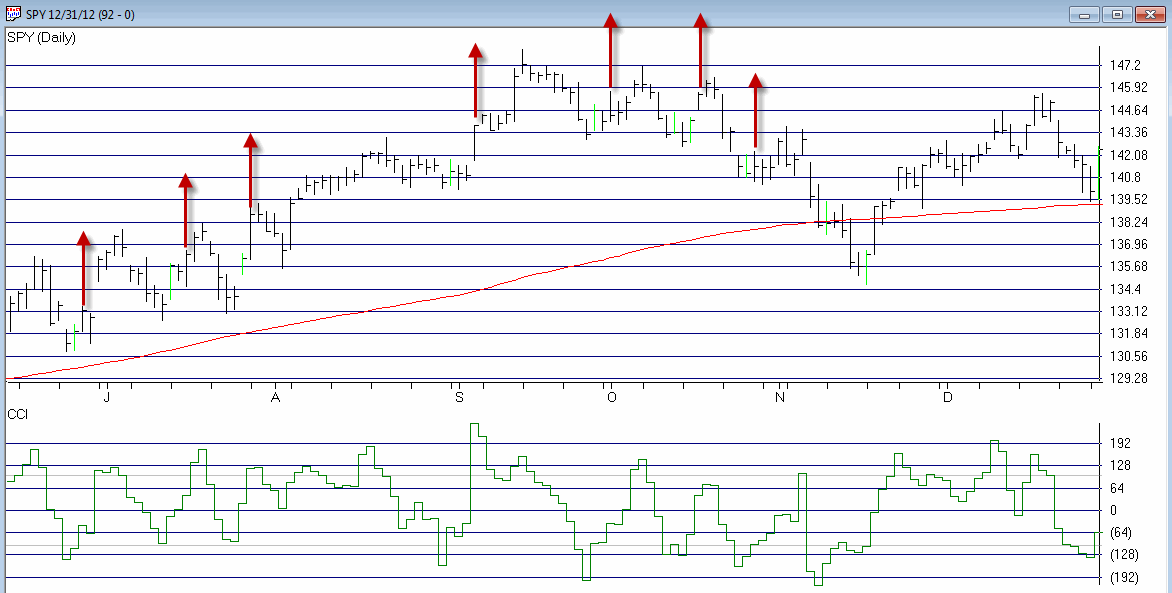
jotm20140330-02Figure 2 – SPY 2012  (Courtesty: AIQ TradingExpert)

Jay Kaeppel
Option Traders Only (An Adjustment You May Not Have Considered)

OK, well there are few things I hate more than to discourage anyone from reading what I write.  That being said, allow me to be candid: If you are not an options trader, and/or if you never expect to trade an option, then I thank you for stopping by but my frank advice is to stop reading right here (and if you are not an option trader but you choose to continue reading, please do not hold it against me personally if and when you reach the “What the heck is this guy talking about” moment.)

Hope to see you back here soon.

Alright, now for anyone who is still left, please note that one of the primary advantages of trading options rests in the potential to “adjust” trades after the initial entry.  In contrast if you buy shares of stock, your choices are basically, sell some shares, sell all shares and buy more shares. 

With options, the potential adjustments that can be made to a trade are almost limitless.  This is something of a blessing and a curse.  Because while it is nice to have choices, the fact is that for most trades there is no “one best adjustment”.  Therefore it is important to think in advance about:

a) What would trigger you to make an adjustment to your option trade?

b) What type or types of adjustments will you consider?

So let’s just walk through one example to give you the idea (non option traders who are still reading: Brace yourself here).

So here is our “example game plan”:

1. Using “something” to decide when to buy a call option on a stock

2. Once the trade profit exceeds +30% then:

3. Sell the original position (taking some profit)

4. Go out another expiration month (give the stock more time to move)

5. Using roughly half of the initial profit (taking some profit and using the rest as “House Money”:

6. Buy the at-the-money call and

7. Sell a call two strikes out-of-the-money

(Note to non option traders: You were warned that this moment would come.)

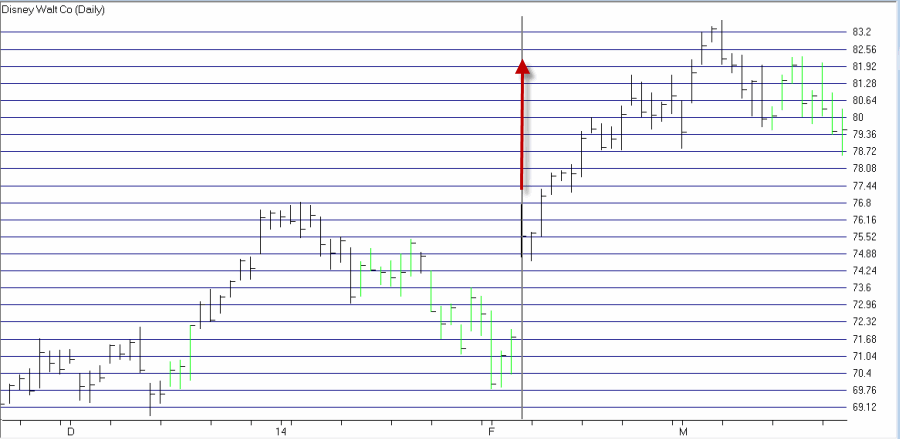
In Figure 1 we see DIS.  On the date with the red arrow we are going to call this a “buy signal” (remember this article is not about “when to buy”, so for that you are kind of on your own at the moment).  jotm20140326-01Figure 1 – DIS take a turn for the better, so buy a call option (Courtesty: AIQ TradingExpert)

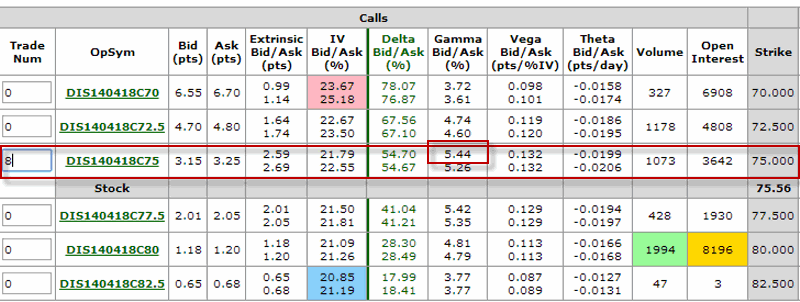
So let’s assume we want to buy a call option on DIS. In Figure 2 I am selecting the option with the highest Gamma and at least 60 days left until expiration.  High gamma gives us some “bang for the buck” and 60 days gives us two months for “something” to happen. 

In this case we are buying 8 of the Apr 75 calls at $3.25 a piece, or $2,600 of initial risk.jotm20140326-02Figure 2 – Buying DIS Apr 75 call options (Courtesy: www.OptionsAnalysis.com)

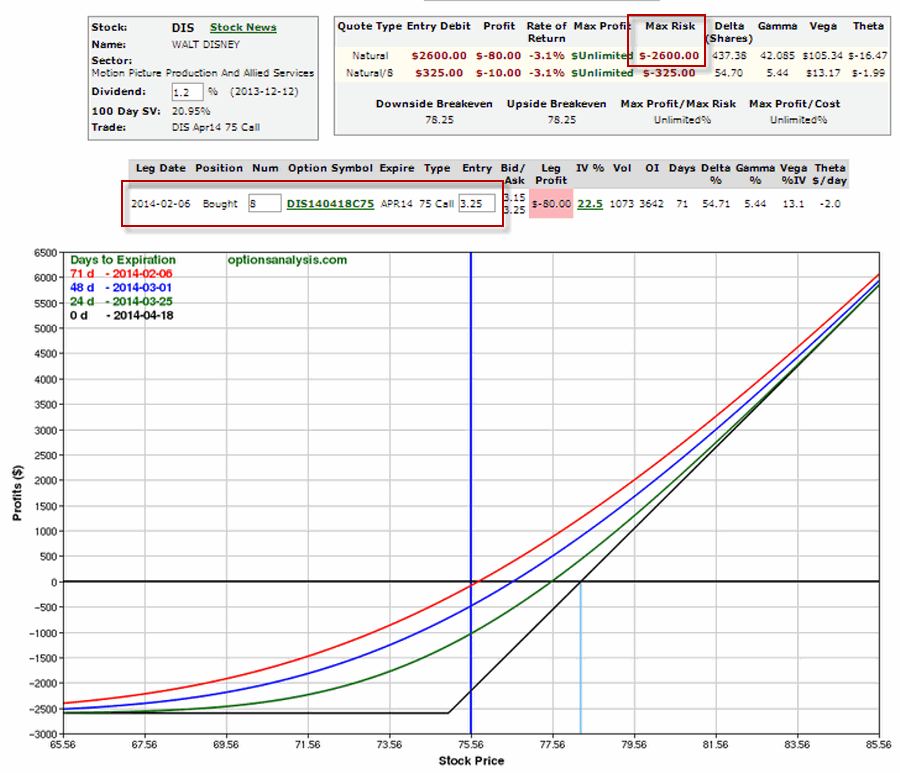
Figure 3 displays the trade particulars and the risk curves for the initial trade.  Again, the key thing to note is that we have risk of $2,600.  Also that there are 71 days left until option expiration.jotm20140326-03Figure 3 – DIS Apr 75 risk curves (Courtesy: www.OptionsAnalysis.com)

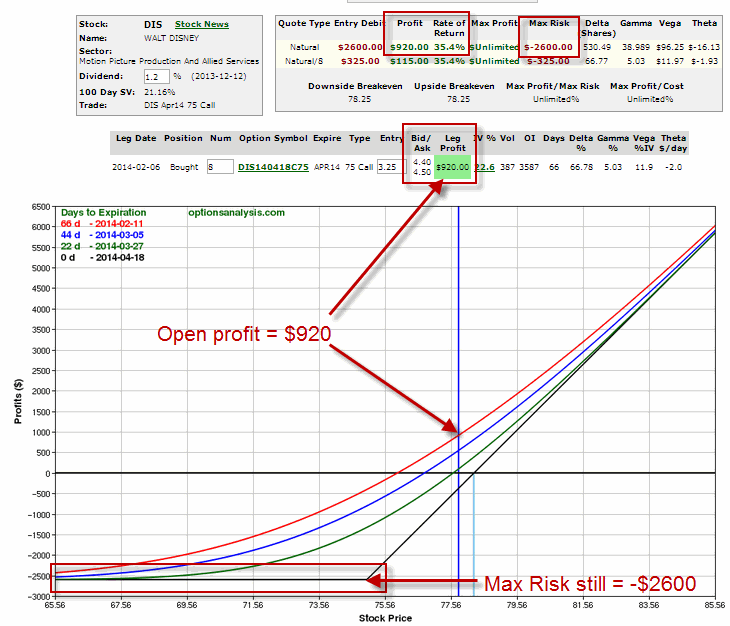
In this example, we got lucky and DIS followed through quickly to the upside and our 30% profit target was reached on 2/11 as you can see in Figure 4.jotm20140326-04

Figure 4 – Profit now in excess of 30% – but risk is still $2,600 (Courtesy: www.OptionsAnalysis.com)

The good news is that we have an open profit of $920; the bad news is that if DIS turns back down we can not only give back the $920 profit but also our original $2,600 investment.

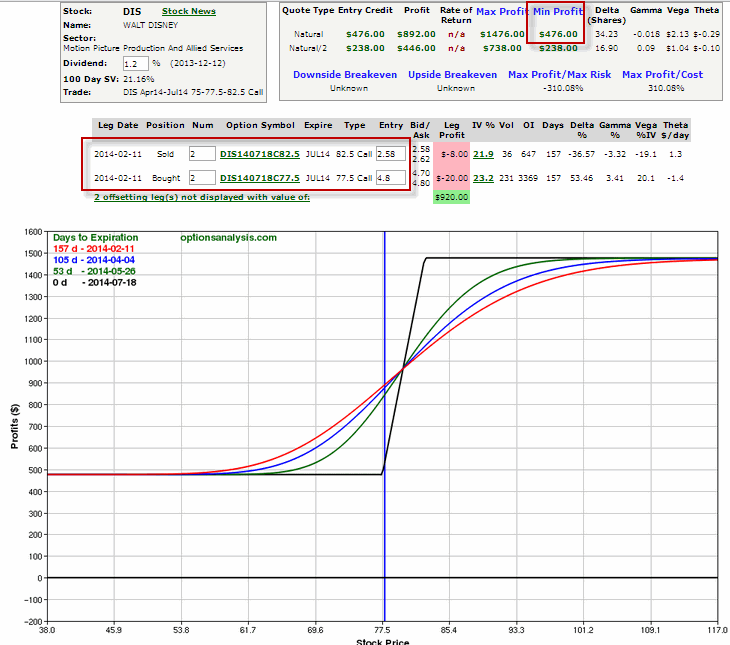
So now we do our adjustment as displayed in Figure 5.  We:

*Close the initial position

*Go out another expiration month

*Using roughly half of our open profit we buy the at-the-money call and sell an equal number of calls two strikes out-of-the-money.

Thus we:

*Sell 8 April 75 calls

*Buy 2 July 77.5 calls

*Sell 2 July 82.5 calls

These adjustments are displayed in Figure 5 (click Figure to enlarge)jotm20140326-05Figure 5 – Adjusting the original DIS trade (Courtesy: www.OptionsAnalysis.com)

The risk curve for the new position appears in Figure 6.jotm20140326-06Figure 6 – Risk curves for adjusted DIS trade (Courtesy: www.OptionsAnalysis.com)

As you can see in Figure 6 there is some good news and some bad news. 

*The bad news is that the adjusted position as limited upside potential (for the record, one alternative to consider would be to simply buy 1 July 77.5 call for $480 instead of buying 2 77.5 calls and selling 2 82.5 calls).

The good news is that we have now “locked in” profit of $476 and are essentially playing with “house money.”  Also we now have 157 days until expiration for “something” to happen. 

At this point, the next step is to decide what if anything to do from here. 

Summary

So does this simple example encapsulate the “Be All, End All” of option trading adjustments.  Hardly.  In fact my guess is that many readers may not be terribly impressed with the adjustment that takes away our unlimited profit potential.  But as I said, there are many possibilities when it comes to adjusting an option trade.  Your job is to consider the possibilities in advance and act when the proper time arrives. 

Hopefully the example in this article hopefully provides some “food for thought.”

Jay Kaeppel

If This Rally Fails……

As I write the stock market is headed higher.  As a trend-follower by nature (sorry it’s just my nature) I try to avoid sitting around and stewing in “The End is Near” type of thinking. For the record there is a lesson in that.  Stop for a moment and think about all of the predictions of “the top” you have heard or read in roughly the last 17 months or so as the market has moved relentlessly higher (Thank you Fed – for now).

Those predictions all fall into one of three categories – Wrong, wrong or wrong.

Still, the phrase that “all good things got to come to an end” remains essentially a universal truth.  My hope is that the major averages (and the majority of stocks) will break through to the upside and take out their recent highs and continue to power higher.  But if this rally fails…………it might make sense to be prepared.  Please note that I am not intending to imply that if the market fails to make new highs that Armageddon will ensue.  But the market does appear to be losing some momentum (more on this topic in a moment).  And once the “worm turns”, well, corrections tend to happen pretty quickly and at times pretty ferociously. 

So my best advice at the moment is “enjoy the ride, but please take a moment to locate the nearest exit.”   

Is The Market Losing Momentum?

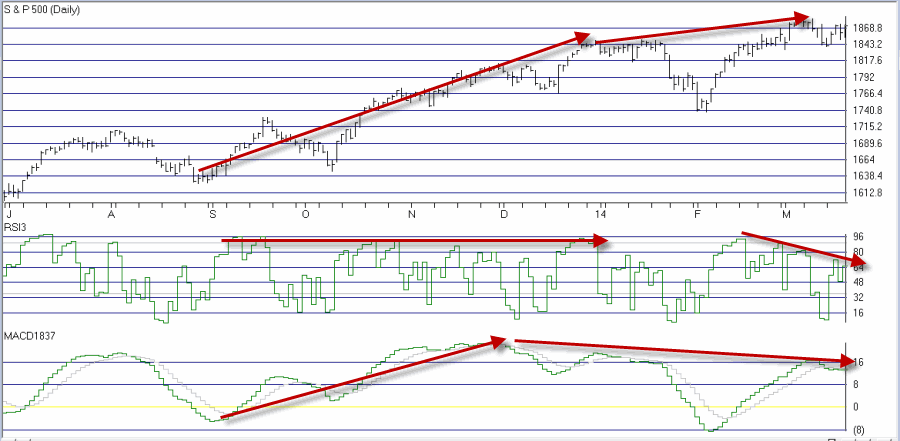
Figure 1 displays the S&P 500 daily bar chart at the top with the 3-day RSI and the MACD (18/37/9) indicator at the bottom. jotm20140321-01Figure 1 – RSI and MACD creating bearish divergence from SPX (Courtesy: AIQ TradingExpert)

Note that during the second half of 2013 as the S&P 500 moved higher both of the indicators confirmed the move.  Since the first of this year both indicators have been forming a bearish divergence – i.e., price moves to a new high while the indicators do not.  Now once again it should be noted that simple divergences happen from time to time and do not imply the end of the world as we know it.  But they do flash a warning sign that alert traders should pay attention.

So there are two scenarios to watch for:

1) The S&P 500 index and other major average move to new highs and the indicators “stop diverging” and once again “start confirming” (This is “Good”).

2) The S&P 500 and other major average fail to make a new high or briefly reach new high ground and then reverse, while the indicators continue to signal weakness (This is “Bad”).

My advice is to pay close attention in the days and week ahead. 

One Way to Play

This idea is merely “food for thought” and a little too soon to act upon in my opinion (i.e., the time to consider acting is if and when the market fails to follow through to a new high and the indicators remain weak).  But if you want to consider a “cheap hedge” here is an example that uses the “Garbage Trade” I’ve written about (that I learned from Gustavo Guzman) of late.

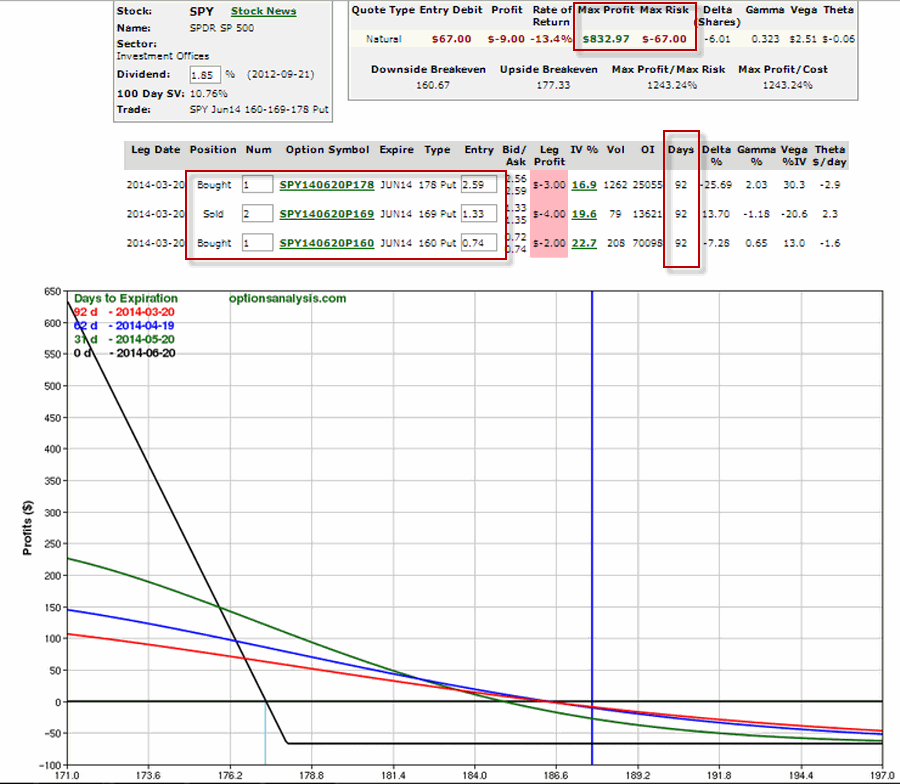
The example trade displayed in Figure 2 involves:

Buying 1 June SPY 178 put option

Selling 2 June SPY 169 put options

Buying 1 June SPY 160 put options

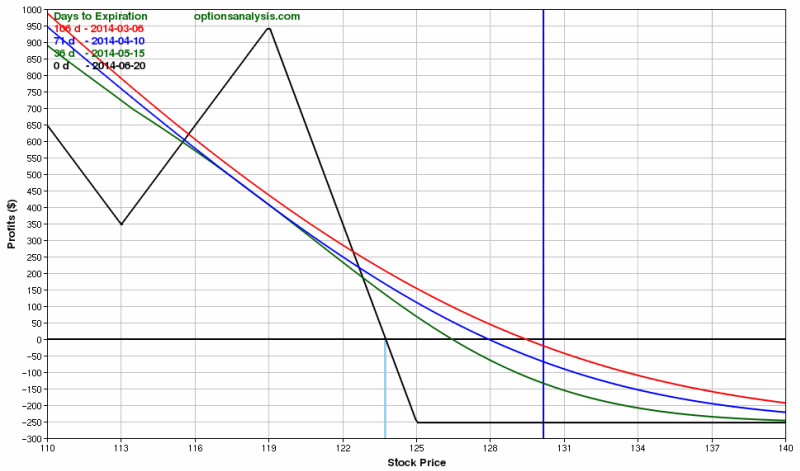
jotm20140321-02 Figure 2 – Example “Cheap Hedge” using SPY put options (Cost = $67) (Courtesy: www.OptionsAnalysis.com)

At present prices this trade costs $67 to enter.  If SPY got back down to about 181 this trade would generate an open profit in the range of 100%.  If things actually did “fall apart” (again, not “predicting” just “preparing”) this trade would generate a profit of several hundred percent.

Again, not really a trade to make right now, but rather an idea to keep in the back of your mind, you know, just in case…..

Jay Kaeppel
‘March Market Madness’

Is there anything better than March Madness?  I mean after enduring a particularly brutal winter how great is it that we are rewarded by being offered the opportunity to show how utterly clueless we really are by sitting down and picking the winners of 60 some odd basketball games, most of which are to be played between teams that most of us know absolutely nothing about.  Like I said, what could be better than that? And just for the record, if my daughter beats me again this year I am sending her to military school (I mean it this time!)

But as much fun as all of this is, I am personally more excited about the March Madness opportunities shaping up in the financial markets.  So let’s look at “the brackets”:

(Going) North Bracket: Keepin’ it Simple in Stock Indexes Redux

In my last piece (http://tinyurl.com/luxu8r8) I wrote about a simple timing method for trading stock index options.  Well, as fate would have it the method fired off a “buy” signal at the close on Monday 3/17.  Lest anyone get too excited just remember that – like any system – this one can generate losing trades just as easily as it can winning trades. 

Anyway, let’s do a quick review and look at the latest “example” trade.

MACD as a Trading Catalyst

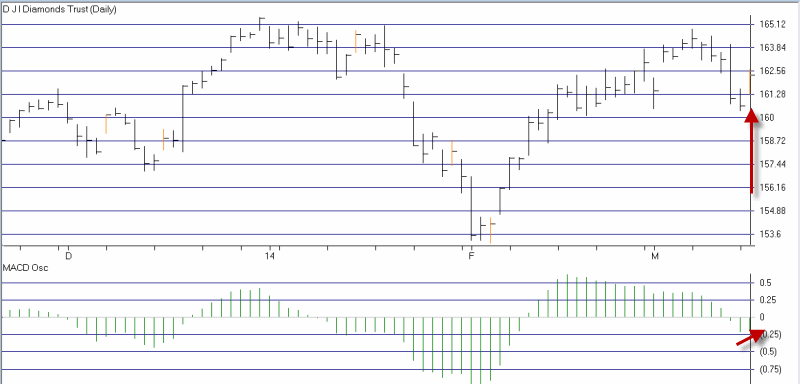
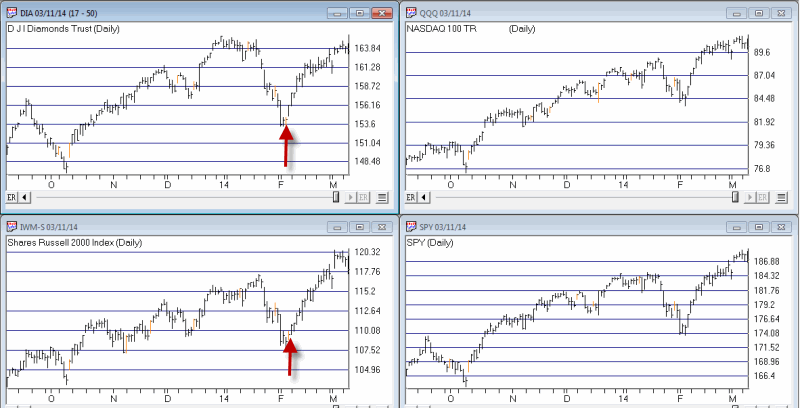
As you can see in Figure 1, for ticker DIA (I look at 4 tickers – SPY, QQQ, IWM and DIA – a signal from any one triggers a trading signal), the daily MACD historgram using the standard default values of 12-26-9 dropped to negative territory nd then reversed higher for one day.    jotm20140318-01Figure 1 – Ticker DIA with MACD “Signals” (Courtesy: AIQ TradingExpert)

Using the Signals

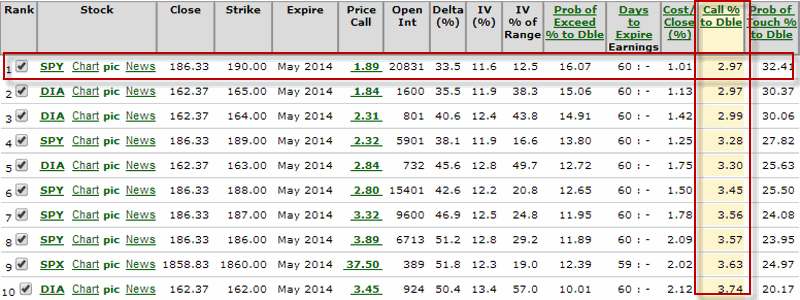
As I detailed last week, the next step is to use the “Percent to Double” routine at www.OptionsAnalysis.com and run a test on call options on the major stock indexes.  The output screen for 3/17/14 appears in Figure 2.jotm20140317-02Figure 2 – Percent to Double Output Screen (Source: www.OptionsAnalysis.com)

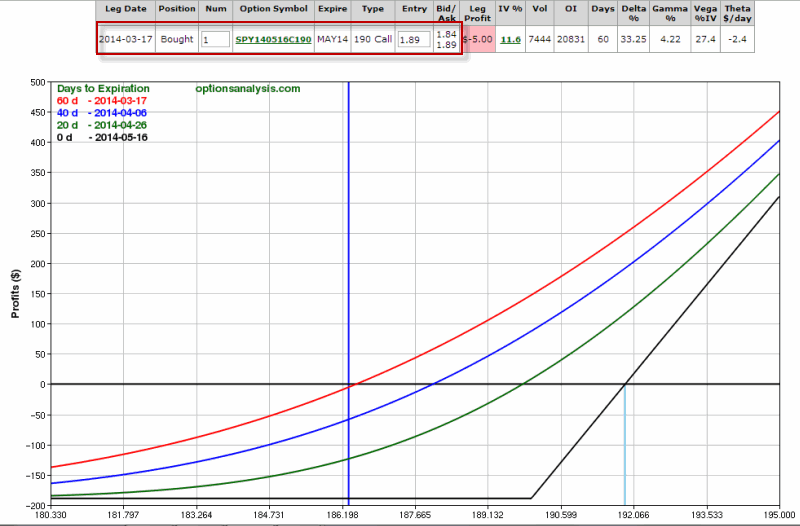
The top trade in the list involves buying SPY May 190 call.  The risk curves for this trade appear in Figure 3.jotm20140327-03Figure 3 – SPY Call Trade (Source: www.OptionsAnalysis.com)

The exit signal I described last time out is triggered when the MACD histogram moves to positive territory and then declines for one day.  As always, this example is for “educational purposes” only and does not constitute a trade recommendation.

(Going) South Bracket: Garbage in Gold Trade Redux

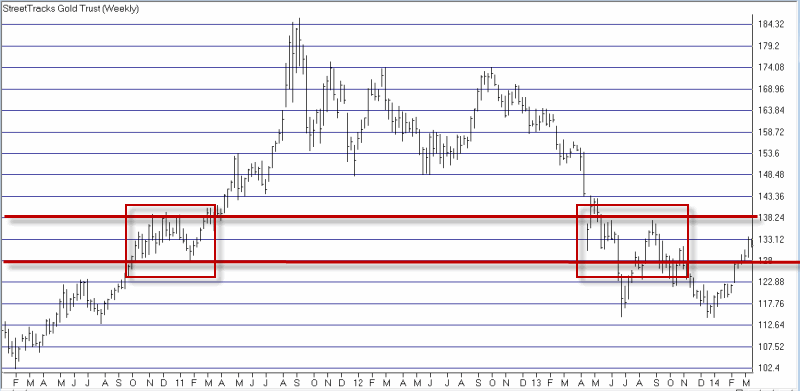
In another previous article (http://tinyurl.com/oex94tc) I wrote about about an “explosive garbage trade” (no seriously) using options on ticker GLD.  So far that trade is at a loss but remains an interesting case study.  In Figure 4 you can see that GLD ran up hard into the heart of the key 128-138 resistance zone and then (at least for one day) reversed. jotm20140317-04Figure 4 – Ticker GLD into the resistance zone

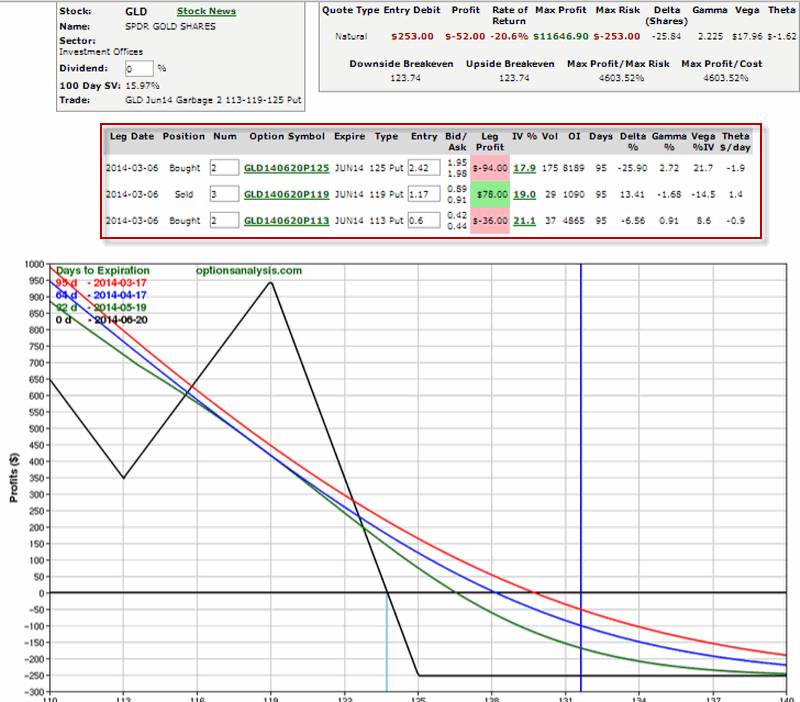
The “garbage trade” I highlighted can start to make money quickly if GLD falls back down.  The maximum loss possible on the trade is -$253. jotm20140317-05Figure 5 – GLD Explosive Garbage Trade

 (Other Going) South Bracket: Whack a VXX Mole Redux

In (http://tinyurl.com/kjwhsh7) I wrote about a simple way to play the short side of volatility using put options on ticker VXX.  In a nutshell:

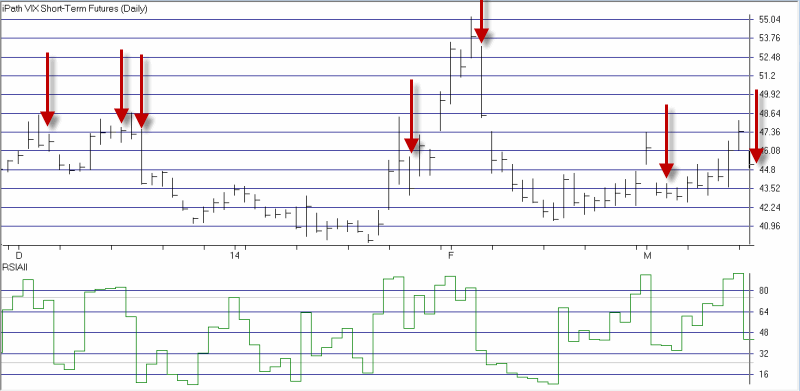
*RSIAll is the average of the 2, 3 and 4-day RSI values for ticker VXX.

*When RSIAll rises to 80 or above, look to buy a put option on ticker VXX when VXX drops below the low of the previous two trading days.

As you can see in Figure 6, this will occur if VXX trades below 44.93 on 3/18. jotm20140317-06 Figure 6 – Whack a VXX Mole Setup

Midwest Bracket: It’s (G)rainy Season Redux

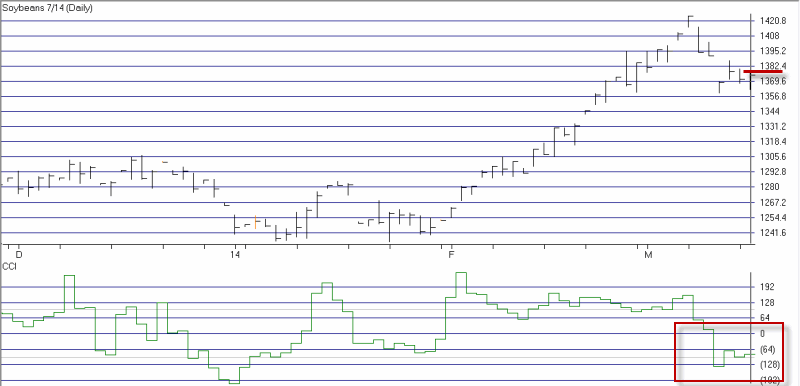
In (http://tinyurl.com/q2omcxm) I wrote about a Seasonal/Technical method for trading soybeans.  The “entry rules” are essentially as follows:

-If today is between January 1st and May 15th

-If the CCI Indicator (Commodity Channel Index) drops below -120 and then ticks higher for one day

-Then buy the next time July soybeans exceed the previous trading day’s high.

As the CCI indicator recently dropped below -120 and turned up this signal could occur on 3/18 if July soybeans exceed 1378.75.jotm20140317-07Figure 7 – Soybeans (G)rainy Season Setup

Summary

So lot’s of possible “signals” based on some mechanical setups.  Kind of like my own personal “Final Four.”  However, as always, because I am not a financial advisor but rather a financial, well – geek – you should not consider anything that appears herein to be a recommendation.  The purpose of these items is simply to educate you to the fact that there are mechanical methods available that can help you as a trader to put the odds on your side.

Jay Kaeppel
Keepin’ It Simple With Stock Index Options

Like a lot of people who have been in this business a long time, I have reached a point where I hardly ever find two numbers that I don’t want to multiply, divide, or compare the relative strength of.  In fact, one of the easiest traps for us “market analyst” types to fall into is to think that the more numbers we crunch and the more indicators we analyze, the better.

In the immortal words of whoever said it first, “tain’t necessarily so.”

So let’s look at something “simple” that we can use as a “catalyst”. 

MACD as a Trading Catalyst

MACD – an indicator developed by a gentleman named Gerald Appel back in what I longingly refer to as the “Hair Era” in my life – has long been a favorite of traders.  And for good reason as there are many varying applications.  We will focus on one.

*We will look at 4 tickers – SPY, QQQ, IWM and DIA, which are ETFs that track the S&P 500, Nasdaq 100, Russell 2000 and Dow Industrials, respectively.

*For each ticker we will look daily at the MACD indicator using the standard default values of 12-26-9.     

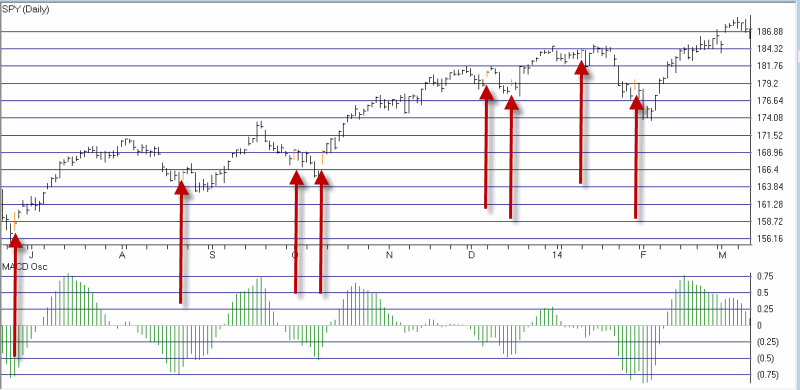
*What we are looking for is for the MACD histogram value to drop below 0 for at least two consecutive days and then reverse to the upside immediately after declining for at least two consecutive days. (AIQ Expert Design Studio Code is pasted at end of article).jotm20140312-01aFigure 1 – MACD RevUp Signals on ticker SPY

*When two or more of the four tickers give a signal within a day or two, we can look at this as a “buy signal”.

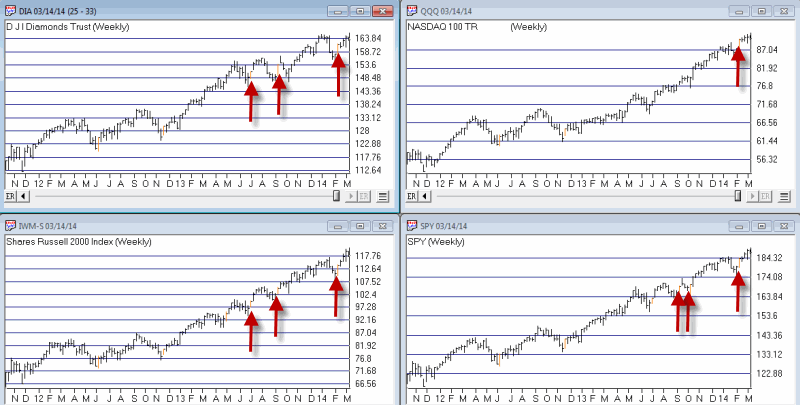
In Figure 2 you see charts of the four tickers with “signal days” highlighted in orange. jotm20140312-01Figure 2 – Four Index ETFs with Daily MACD Buy Signals (Courtesy: AIQ TradingExpert)

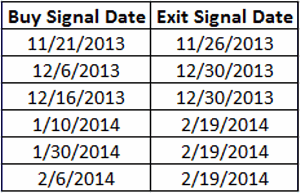
The most recent “buy signal” (was on 2/6/14, which obviously was followed by a great rally.  Of course, the previous signal on 1/10/14 (DIA and SPY) was followed by a sharp decline in late January before a subsequent rally.  So no one should get the idea that any given signal is a “sure thing.”

Recent signals (see Simple Exit Rule below):xx

One other interesting thing to note however is that these signals can also be generated using weekly charts as displayed in Figure 3.jotm20140312-02 Figure 3 – Four Index ETFs with Weekly MACD Buy Signals (Courtesy: AIQ TradingExpert)

Recent buy signals using weekly charts occurred on 2/14/14. 9/13/13 and 7/5/13, all of which were pretty good times to be looking at the long side of the market. 

Using the Signals

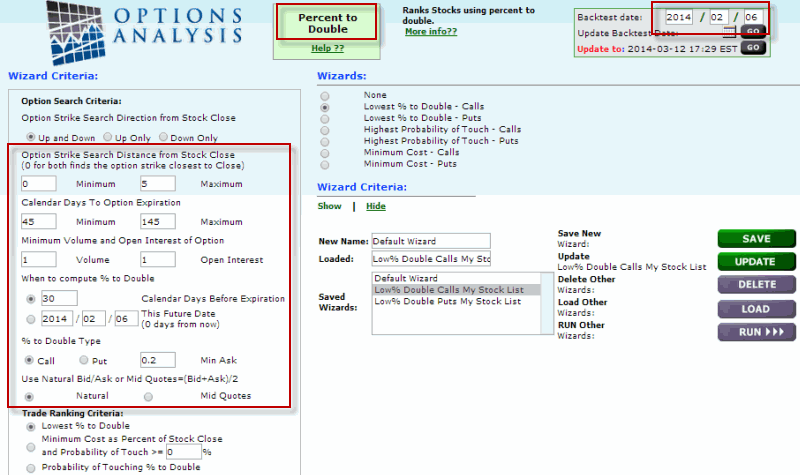
In the interest of “keepin it simple”, perhaps the easiest way to play a “buy signal” from this “system” (such as it is) would be to buy call option on a stock index.  For this we turn to the “Percent to Double” routine at www.OptionsAnalysis.com and run a test on call options on the major stock indexes.  The input screen appears in Figure 4.jotm20140312-03 Figure 4 – Percent to Double Input Screen (Source: www.OptionsAnalysis.com)

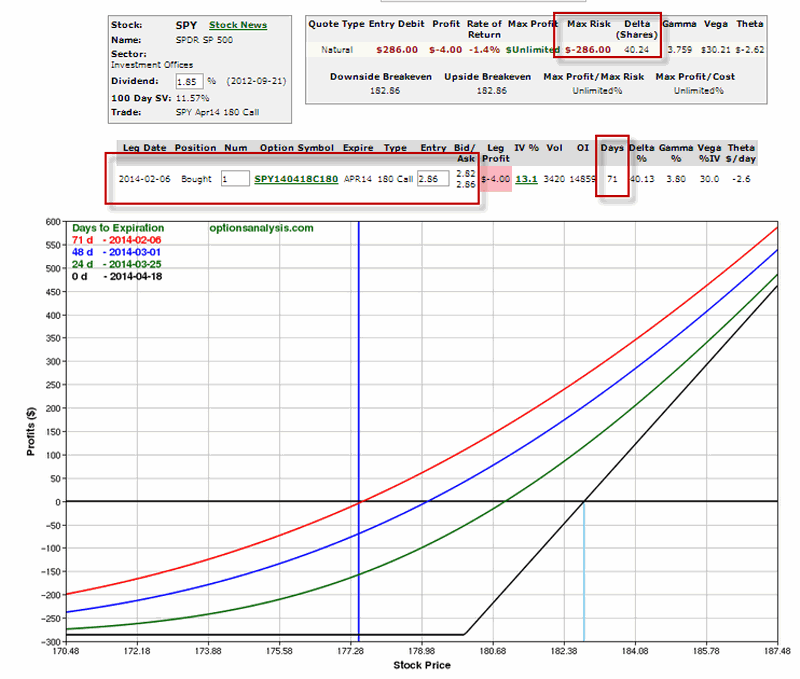
From the output list I skipped several DIA call options and selected the first SPY call option on the output list.  The simple reason is that the SPY option had greater volume, greater open interest and a tighter bid/ask spread.  That position appears in Figure 5. jotm20140312-04Figure 5 – SPY April 180 Call Trade (Source: www.OptionsAnalysis.com)

Our “Simple” Exit Rule

How to manage the trade after it is entered is a topic that could fill several volumes.  But since we are focusing here on “simple” methods – when the MACD oscillator tops out and declines for one day we will exit the trade.

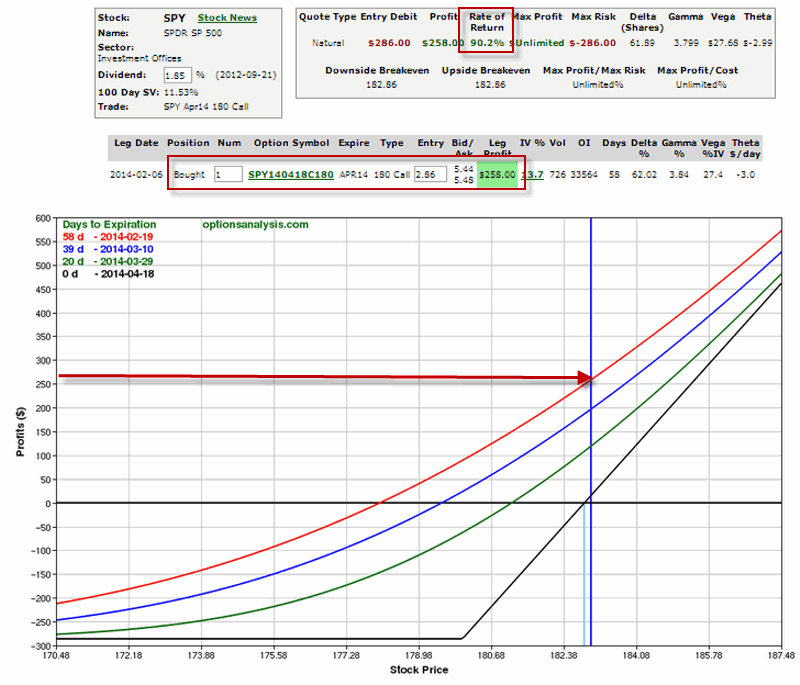
For our example trade this occurred on 2/19/14.  At this point the April SPY 180 call had advanced from $2.86 to $5.44, or +90% as shown in Figure 6. jotm20140312-05 Figure 6 – SPY April 180 Call Trade (Source: www.OptionsAnalysis.com)

Summary

So is this the “World Beater System” that should cause everyone to forget what they are using now.  Hardly.  But for a “simple” set of steps the potential is there to generate some useful trading signals.   As always, traders interested in this type of trading need to do some homework before adopting any new type of trading approach.

Jay Kaeppel
AIQ Expert Design Studio Code = 

MACDRevUp if [MACD Osc]>val([MACD Osc],1) and val([MACD Osc],1)<val([MACD Osc],2) and val([MACD Osc],2)<val([MACD Osc],3) and val([MACD Osc],2)<0.

There’s Garbage in That Thar Gold…

Or should it be, “Thar’s Gold in That There Garbage?”  Well, in any event last time out I wrote about a strategy I learned from Gustavo Guzman, a former colleague of mine.  Essentially a hedging strategy, the Garbage Trade is essentially a “bet a little, maybe make a lot” type of strategy.  Basically, “when all is right with the world” is when you should be concerned about what it is you are not seeing.  This strategy gives you the opportunity to “cover that base” without spending a lot of money to do so.

In case you have never noticed, markets can spend a long time advancing, steadily, quietly, grinding away to ever higher ground.  And then often times, once everyone is comfortable with acknowledging that that particular asset is “clearly in an uptrend”, in the matter of a few short days or weeks the bottom drops out and a large part of the prior gain is wiped out in a fraction of the time  it took to earn it.  And let’s be honest, you almost never see it coming.  That’s where the garbage trade comes in.  For the details please see http://jayonthemarkets.com/2014/03/05/garbage-in-good-things-out/

This time out let’s look at another market that might be candidate for a little “garbage time.”

Gold – Where to From Here?

Gold appears to have put in a near-term bottom and gold stocks in particular have been quite strong of late.  So the natural reaction is to sort of breathe a sigh of relief and start to consider how far the rally in the metal and the shares might last.  But is that the right reaction?  Maybe, maybe not.

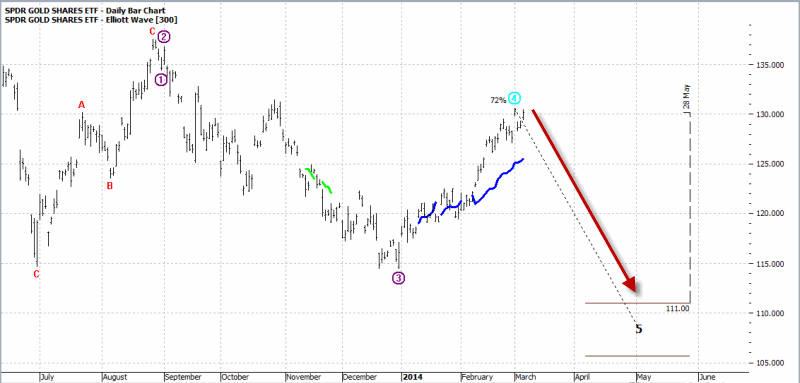
In Figure 1 we see a daily Elliott Wave chart for ticker GLD – the ETF that tracks the price of gold – from ProfitSource by HUBB.  As you can see the latest projection is, well, “one of the painful kind.”  Now just because it appears on this chart doesn’t mean it will actually pan out.  (While I look at Elliott Wave at times I am not a true ElliottHead.  Although I have known people who would just as soon put you in a headlock, wrestle you to the ground and say “I’m not letting you up until you believe!”  Fortunately, they get distracted easily by the next squiggly line that comes along).  Still, it’s something.jotm20140307-01 Figure 1 – Ticker GLD with Elliott Wave Projection (Courtesy: ProfitSource by HUBB)

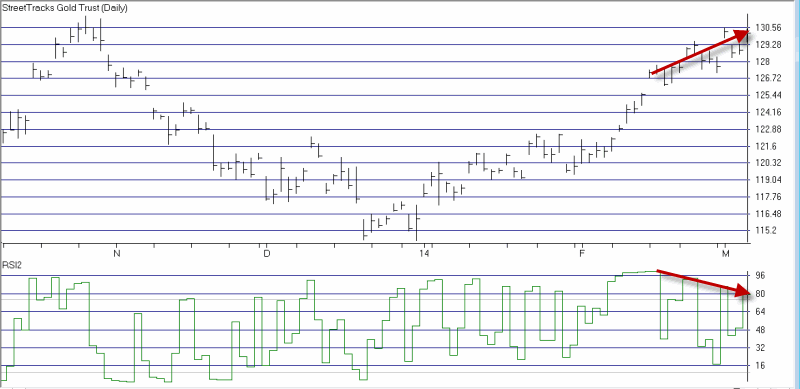
In Figure 2 you see a chart also of GLD, this time from AIQ TradingExpert with the 3-day RSI drawn in the lower clip.  What we have here is your classic “bearish divergence.”  While price has kept moving to higher ground, the RSI has peaked at lower values on three separate occasions.  Again, this does not mean that GLD is guaranteed to decline.  But it too is, well, something. jotm20140307-02Figure 2 – Ticker GLD with Bearish RSI Divergence (Courtesy: AIQ TradingExpert)

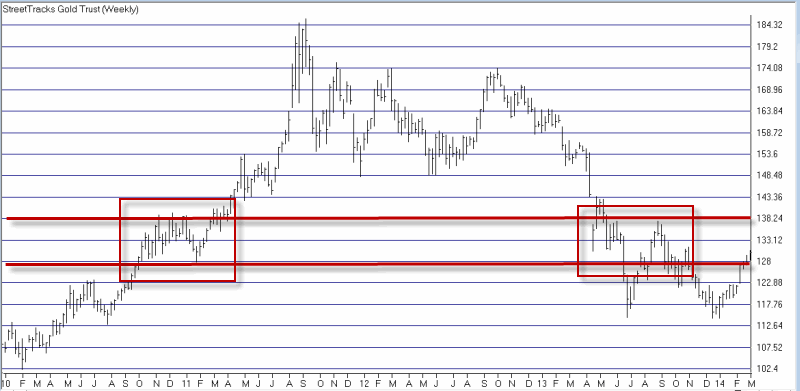
Finally, the 128-138 range has been the “scene” of several support and resistance “battles” waged between GLD bulls and bears in the past.  As you can see in the weekly chart of GLD in Figure 3, during previous skirmishes, GLD has had to do some work to cross through the 128-138 level and come out on the other side.  jotm20140307-03aFigure 3  – GLD entering potentially significant resistance area of 128-138 (Coutresy: AIQTradingExpert)

So in any event, when you put all of this together, well, this my friends is a classic setup for a Garbage Trade, which again, involves risking a couple of bucks on an options trade for the potential of a high percentage return.  Now please note that I did not start pounding the table and demand that you immediately sell short as many gold futures contracts as you possibly can afford.  That would be what we traders often refer to as “stupid.”

The “Classic” Garbage Trade Example

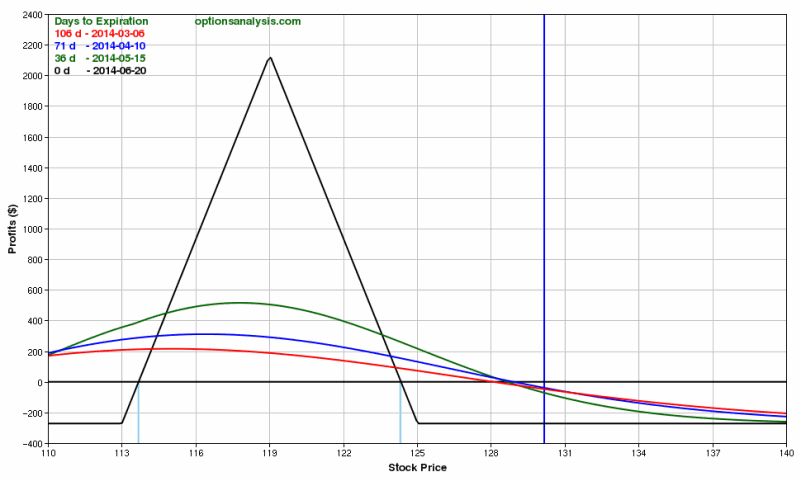
Figures 4 and 5 show a classic 1x2x1 Garbage trade using June puts on GLD. jotm20140307-03Figure 4 – GLD June 125-119-113 puts 1x2x1 ratio (Courtesy: www.OptionsAnalysis.com)

jotm20140307-04Figure 5 – GLD June 125-119-113 puts 1x2x1 ratio (Courtesy: www.OptionsAnalysis.com)

Note the maximum worst case risk is $272.  If GLD does get down much past 119 the profit line starts to rollover, so somewhere in here would be a good place to take profits.  Depending on how soon that target was reached the profit could be anywhere from $200to $550.  A good return for a $270 investment.   

The “Explosive” Garbage Trade Example

(“Explosive Garbage?” Note to myself: think about getting someone to write better titles for me.)  Now let’s look at a way to sort of “go for the gold” (Wow, that was stupid even by my standards) and make a play that can make a lot more if gold really actually does break hard to the downside – while risking roughly the same amount.  Figure 5 and 6 display a trade using the same option strikes (125-119-113) but this time trading them in a 2x3x2 ratio.  In other words:

Buy 2 Jun GLD 125 puts

Sell 3 Jun GLD 119 puts

Buy 2 Jun GLD 113 puts

jotm20140307-05

Figure 6 GLD June 125-119-113 puts 2x3x2 (Courtesy: www.OptionsAnalysis.com) jotm20140307-06Figure 7 – GLD June 125-119-113 puts 2x3x2 (Courtesy: www.OptionsAnalysis.com)

What does this do for us?  Well as you can clearly see in Figure 7 it opens up the potential for unlimited profit.  So in this case, if the Elliott Gods smile and GLD goes in fact plummet down to 111 by the end of May, this trade could generate a profit of $900 to $1,000 roughly. This trade costs $253 to enter.

One comparative note: The 4x8x4 trade by far offers the greater profit potential if the trades are held until June option expiration and GLD happens to be between about 116 and 122.  However, remember that we are not considering these two trades because “we think GLD will be between 116 and 122 on the third Friday of June 2014.”  We are considering these two trades “just in case” GLD for some unforeseen reason breaks hard to the downside between now and the end of May (the Elloitt Wave timeframe).

Summary

So at this point there are a few questions to be asked and answered.

The obvious first question is: Will GLD decline sharply between now and the end of May?  Sadly I have to go with my stock answer: “It beats the heck out of me.” 

So the next question is: Is there a chance it will decline between now and the end of May?  Given the bearish Elliott Wave projection, the bearish RSI divergence and the important resistance level in the 128-133 range, I am going to go ahead and say “Yes” there is a chance.”

If you answered “Yes” to that question, then the next question in “are you willing to bet on the chance it might happen?”  You have to answer that one on your own.

And if you answered “Yes” to the previous question, then the final question is “Do you have $253 bucks?”

Jay Kaeppel
Garbage In, Good Things Out

So you see what I was talking about, right?  Under the category of “I hate it when I’m right”, last week I wrote “when I write an article about a trend that has been playing out time and time again over a several year period – that can pretty much be counted on to put an end to that trend”, referring to the fact that ticker VXX has been in a prolonged downtrend for a number of years.

Within minutes (or so it seems) the Russian Army is on the move. Coincidence?

OK, probably so, but geez, maybe I should try picking tops and bottoms…

Anyway, in light of the newfound fear and loathing that popped back up over the weekend, it is time to review a useful strategy for traders concerned about the downside in the near term.

The Garbage Trade

Several years ago I learned a simple hedging strategy from Gustavo Guzman, a former colleague of mine.  He dubbed it the “Garbage Trade”.  But don’t be fooled by the name, for it is anything but. 

Essentially a hedging strategy, the basic idea of this simple option strategy is to risk a little bit of capital on something that most people don’t think is going to happen.  If it doesn’t happen, OK, you lose a little.  But if it does happen, you make a whole lot.

One word of warning: for the “average” investor – one whose basic approach to investing is one of “buy a stock or mutual fund or ETF and hope it goes up” – this type of trading is quite a foreign concept.  Of course, given the world we live in today, considering alternative ideas to investing and trading might be a good thing.

The Starting Point

The basic idea Guzman taught was that after a market (especially the stock market) had experienced a good run up, a pullback of some sort was invariably due.  So his suggestion was after a run up, buy a put option roughly 5% out of the money.  Then go down the strike prices until you find a put option that you can sell two of which will pay for the first put option you bought (example to follow).  Then if you had gone down say three strike prices from the option you bought to the option you sold, then go down three more strike prices and buy one put at that price. 

Right now all of the “non option junkies” have their fingers poised over the arrow to go back to the Main Web Page.  But wait!! Please at least consider the example below.

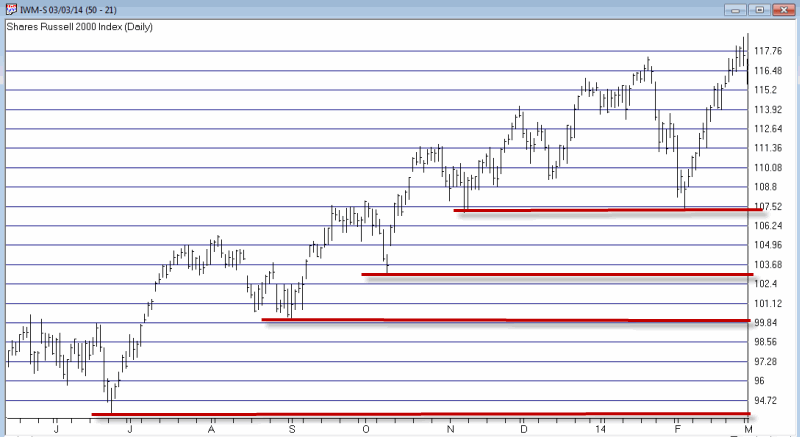
In Figure 1 we see a bar chart for ticker IWM, an ETF that tracks the Russell 2000.  Now let’s assume that a trader is concerned about the potential for a pullback – let’s say based on current geopolitical goings on – but not necessarily outright bearish.  In other words, he doesn’t want to “Sell Everything!”, but would like some protection if things go south for a while. jotm2014-0304-01 Figure 1 – Ticker IWM tracking the Russell 2000 Index (Courtesy: AIQ TradingExpert)

In Figure 1 we can see that if IWM starts to decline there are several natural “price targets” where a trader might consider taking a profit.  But I am getting ahead of myself.

Using Guzman’s outline for the Garbage Trade, one possibility is as follows:

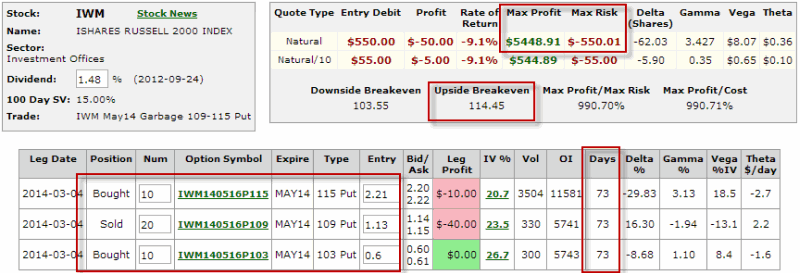
-IWM shares are trading on 3/4/2014 at 120.32.

-If we multiply this by 0.95 we get 114.30

-We can choose either the 114 or the 115 strike price put.  Due to higher volume I will select the May 115 put.

-In order to take in enough premium to pay for the 1115 put we would sell 2 May 109 puts for 1.13 each (or $113 x 2 = $226 premium taken in)

-We then go own six more point and buy one May 103 put for 0.60, or $61.

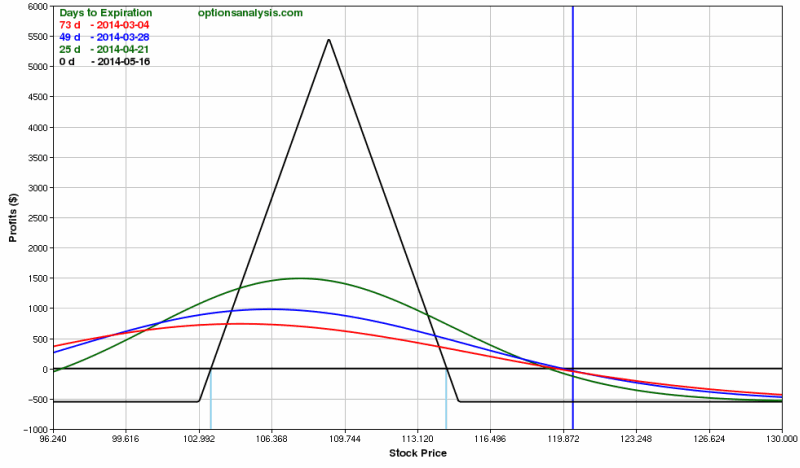
All told, it costs all of $55 to buy a 1 by 2 by 1 position.  The risk curves for a 10-lot position costing $550 appears in Figures 2 and 3.jotm20140304 - 02Figure 2 – IWM Garbage Trade (Courtesy: www.OptionsAnalysis.com)jotm20140304 - 03Figure 3 – IWM Garbage Trade (Courtesy: www.OptionsAnalysis.com)

So basically, one of a couple things will happen.  In a nutshell, either IWM will suffer a pullback and this position will offer the potential to make a fairly high return on capital, or the trader stands to lose a maximum of $560.

A couple of things to note:

*If IWM moves to new highs the trader can either:

a. Exit the trade and cut his loss

b. Continue to hold the position – at least for a while – just in case something bad happens later rather than sooner

*If IWM does start to decline then the trader should have a profit target in mind and should pay attention to the price level at which the risk curve for the latest date will “peak” and start to “roll back down.”  Figure 1 displays several potentially useful “price target levels” where a trader might consider taking a full or partial profit.

Summary

As always, this example is not presented as a “recommendation”.  It is simply an example of one way to get a little exposure to the downside if you start to feel some “concern.”

The vast majority of traders who look to options focus on buying calls and puts in hopes of maximizing a specific market timing method, and/or selling covered calls against stocks they hold.  Nothing wrong with these ideas, but the real power of options is that they afford you the opportunity to “attempt” things you normally could not or would not do using stocks, ETFs or futures.

The Garbage Trade is an example of one way to use options to risk small amounts of capital with the potential for significant percentage gains.

As always this example is not a “recommendation”, only an example.  Note that it would seem like an illogical time to put on a trade like this.  The stock market has bounced back from the Russia/Ukraine crisis in one day and the current trend clearly remains to the upside.

For the record: At exactly the point when the Garbage Trade seems like a waste of money….is exactly the time to consider putting it on.

Jay Kaeppel