Sometimes trading ideas result from putting a “few pieces of the puzzle together”. So here’s an “idea” that does just that (please note that I said “idea” and not “recommendation”).
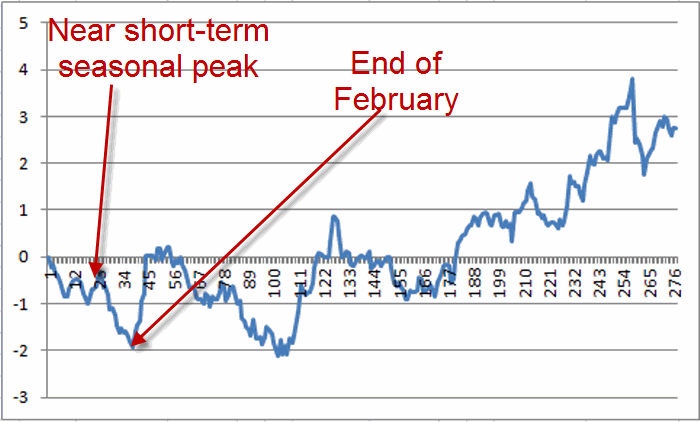
Figure 1 displays the annual seasonal trend for t-bonds since 1978. As you can see there tends to be weakness early in the year and better times later in the year. Needless to say not every year follows this map. Nevertheless there is an interesting confluence of “things” at the moment. To wit:
#1. The seasonal chart in Figure 1 is indicating that we are entering a seasonally unfavorable period for t-bonds that extends through the end of February.  Figure 1 – Annual Seasonal Trend Chart for T-Bonds (weakness early, strength later)
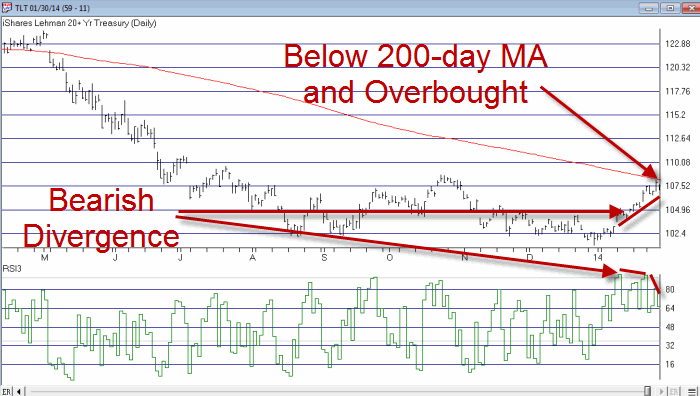
#2. As shown in Figure 2, T-bonds (as measured using the exchange-trade fund ticker TLT ) recently experienced a “rally in a downtrend”, i.e., TLT is below its 200-day moving average and the 3-dy RSI was recently overbought and carved out a slight bearish divergence.
 Figure 2 – Ticker TLT – overbought in a downtrend (Courtesy: AIQ TradingExpert)
So does this confluence of factors guarantee a new downtrend? I wish it were that simple. Still, the trader with a penchant for, well, trading, might feel the urge to play the downside. One choice would be to sell short shares of ticker TLT. But that strategy involves margin and unlimited risk – definitely not my favorite combination. So how about a low cost play to participate in any downside t-bonds action with limited risk?
The most aggressive play would be to buy an out-of-the-money TLT put option and to try to leverage any meaningful downside movement. But remember, we are making no forecast as to how far TLT may fall (if it falls at all) so we would like to be in a position to profit even on a relatively small downside move.
FOR THE RECORD: The “seasonal” part of this setup technically does not begin until the close on 1/31/14. So what follows is an example of a trade based on data from 1/30/14.
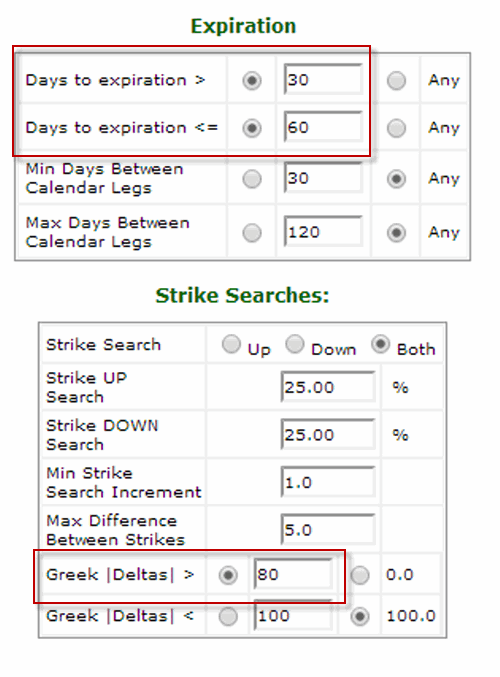
So in this example we will look at the “stock replacement strategy” and consider buying a deep-in-the-money put option on TLT. To do this I will use the “Find Trades++” routine at www.OptionsAnalysis.com. In Figure 3 you see that I have set up to look or put options with at least 30 days left until expiration and a delta of 80 or more (technically this implies a put option delta of -80 to -100, but I’m not in full options geek mode at the moment so we will just leave it at that). In a nutshell we are looking for a put option whose price changes will track closely with that of TLT shares themselves. In a nutshell a delta of 80 or more implies that if TLT moves $1.00 in price the option will move $0.80 (OK, so much for avoiding full options geek mode). 
Figure 3 – Buy Put inputs (Courtesy: www.OptionsAnalysis.com)
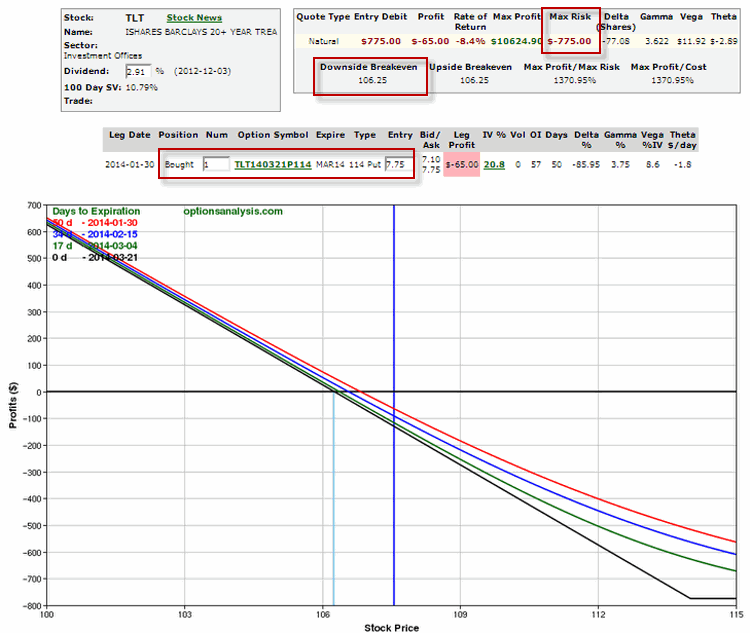
After running “Find Trades++” I then sort the output list to find the trade in the list with the highest “gamma”. The trade that comes up is buying the March 114 put option for $7.75. The option has a delta of 77.78 and a gamma of 3.62. This means that if TLT moves $1 in price this option will moves roughly $0.78 in price and the delta will either rise or fall by 3.62 depending on whether TLT falls or advances (Wow, we have somehow plunged into options geek hell, my apologies). The risk curves for this trade appear in Figure 4. Figure 4 – Risk curves for deep-in-the-money TLTput option trade (Courtesy: www.OptionsAnalysis.com)
A few things to note:
-This option has a very wide bid/ask spread of 7.10/7.75, so a limit order of some sort would seem to make sense.
-TLT is trading at $107.56. This will trade will move point-for-point with TLT shares if and when TLT falls below $106.25.
-It is possible to buy a much less expensive option with a much tighter bid/ask spread and that offers a higher percentage profit potential (example, the March 106 put for $1.27). The only reason for considering the deep-in-the-money put is to seek point-for-point movement with the underlying TLT shares and to limit the potentially negative effects of time decay.
Summary
So will this trade make money? It beats me. Is it even a good idea? Well, I guess that is in the eye of the beholder. The primary point here is simply to point out one way to combine:
-A seasonal trend (i.e., historical weakness during this time frame for t-bonds)
-A technical setup (i.e., an overbought market that is bumping up against a long-term moving average) and;
-A bearish indicator divergence (4-day RSI not confirming a new price high.
-A limited risk strategy that ties up and risks several hundred dollars (rather than several thousand dollars) yet which can still achieve point-for-point movement with the underlying shares (once below the breakeven price.
Wow, this sounds great! Gee, I hope it works out. Ah, there’s the rub. No matter how “perfectly aligned the stars” seem to be, no trade is ever certain to generate a profit (I hate that part about trading). Hence the reason a measured risk option trade makes a lot of sense.
Finally, just remember that this is an “example” of something, not a “recommendation”.
Jay Kaeppel

