Monthly Archives: January 2014

A ‘Seasonal/Technical Setup’ in T-Bonds

Sometimes trading ideas result from putting a “few pieces of the puzzle together”.  So here’s an “idea” that does just that (please note that I said “idea” and not “recommendation”).

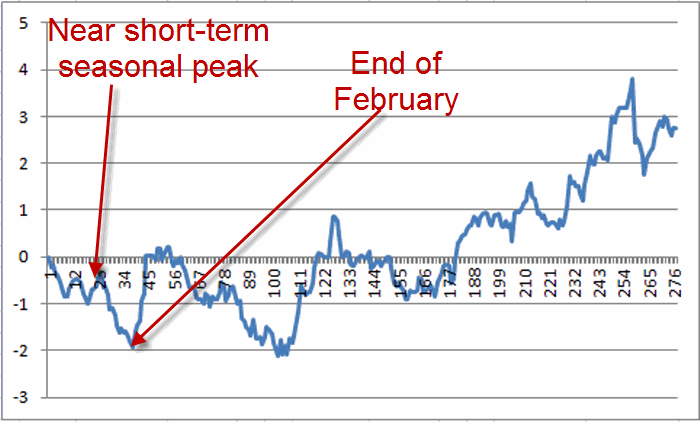
Figure 1 displays the annual seasonal trend for t-bonds since 1978.  As you can see there tends to be weakness early in the year and better times later in the year.  Needless to say not every year follows this map.  Nevertheless there is an interesting confluence of “things” at the moment.  To wit:

#1. The seasonal chart in Figure 1 is indicating that we are entering a seasonally unfavorable period for t-bonds that extends through the end of February. jotm20140130-01 Figure 1 – Annual Seasonal Trend Chart for T-Bonds (weakness early, strength later)
#2. As shown in Figure 2, T-bonds (as measured using the exchange-trade fund ticker TLT ) recently experienced a “rally in a downtrend”, i.e., TLT is below its 200-day moving average and the 3-dy RSI was recently overbought and carved out a slight bearish divergence.
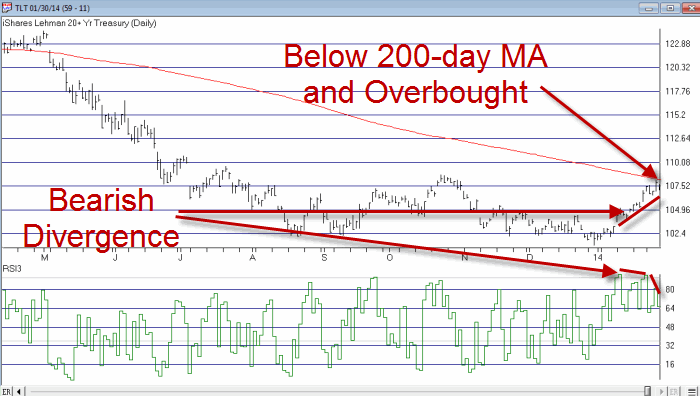
jotm20140130-02  Figure 2 – Ticker TLT – overbought in a downtrend (Courtesy: AIQ TradingExpert)

So does this confluence of factors guarantee a new downtrend?  I wish it were that simple.  Still, the trader with a penchant for, well, trading, might feel the urge to play the downside.  One choice would be to sell short shares of ticker TLT.  But that strategy involves margin and unlimited risk – definitely not my favorite combination.  So how about a low cost play to participate in any downside t-bonds action with limited risk?

The most aggressive play would be to buy an out-of-the-money TLT put option and to try to leverage any meaningful downside movement.  But remember, we are making no forecast as to how far TLT may fall (if it falls at all) so we would like to be in a position to profit even on a relatively small downside move.

FOR THE RECORD: The “seasonal” part of this setup technically does not begin until the close on 1/31/14.  So what follows is an example of a trade based on data from 1/30/14.

So in this example we will look at the “stock replacement strategy” and consider buying a deep-in-the-money put option on TLT.  To do this I will use the “Find Trades++” routine at www.OptionsAnalysis.com.  In Figure 3 you see that I have set up to look or put options with at least 30 days left until expiration and a delta of 80 or more (technically this implies a put option delta of -80 to -100, but I’m not in full options geek mode at the moment so we will just leave it at that).  In a nutshell we are looking for a put option whose price changes will track closely with that of TLT shares themselves.  In a nutshell a delta of 80 or more implies that if TLT moves $1.00 in price the option will move $0.80 (OK, so much for avoiding full options geek mode).  jotm20140130-03
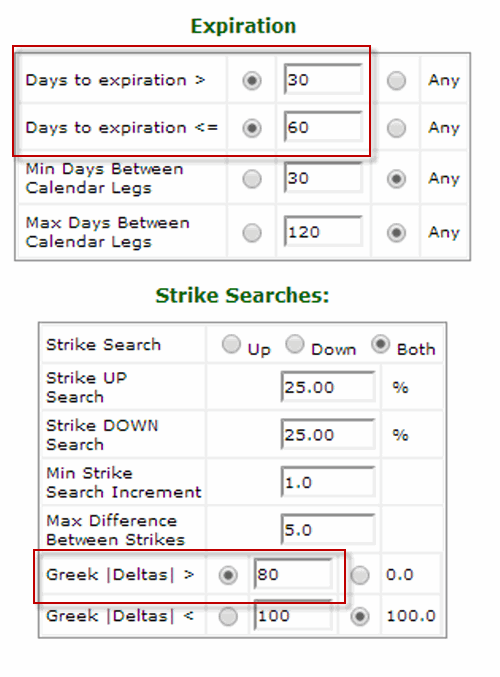
Figure 3 – Buy Put inputs (Courtesy: www.OptionsAnalysis.com)


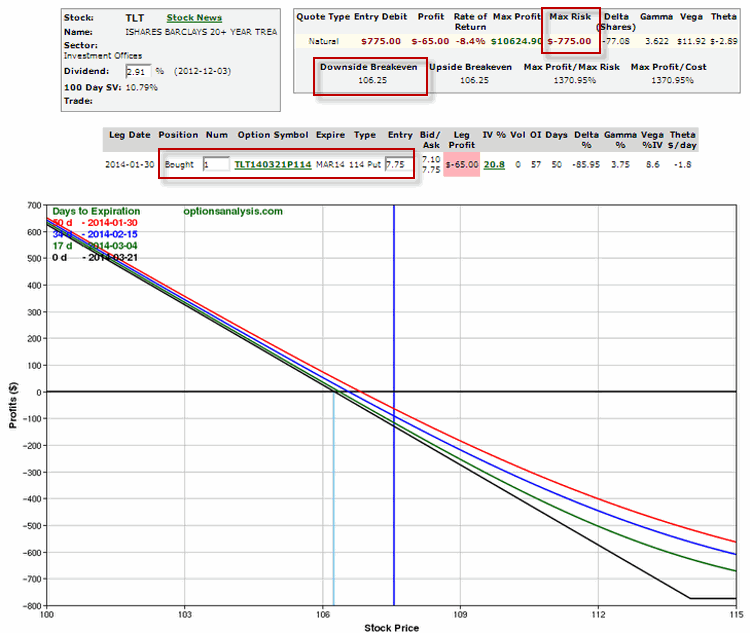
After running “Find Trades++” I then sort the output list to find the trade in the list with the highest “gamma”. The trade that comes up is buying the March 114 put option for $7.75.  The option has a delta of 77.78 and a gamma of 3.62.  This means that if TLT moves $1 in price this option will moves roughly $0.78 in price and the delta will either rise or fall by 3.62 depending on whether TLT falls or advances (Wow, we have somehow plunged into options geek hell, my apologies).  The risk curves for this trade appear in Figure 4.jotm20140130-04 Figure 4 – Risk curves for deep-in-the-money TLTput option trade (Courtesy: www.OptionsAnalysis.com)
A few things to note:

-This option has a very wide bid/ask spread of 7.10/7.75, so a limit order of some sort would seem to make sense.

-TLT is trading at $107.56.  This will trade will move point-for-point with TLT shares if and when TLT falls below $106.25.

-It is possible to buy a much less expensive option with a much tighter bid/ask spread and that offers a higher percentage profit potential (example, the March 106 put for $1.27).  The only reason for considering the deep-in-the-money put is to seek point-for-point movement with the underlying TLT shares and to limit the potentially negative effects of time decay.


Summary

So will this trade make money?  It beats me.  Is it even a good idea?  Well, I guess that is in the eye of the beholder.  The primary point here is simply to point out one way to combine:

-A seasonal trend (i.e., historical weakness during this time frame for t-bonds)

-A technical setup (i.e., an overbought market that is bumping up against a long-term moving average) and;

-A bearish indicator divergence (4-day RSI not confirming a new price high.

-A limited risk strategy that ties up and risks several hundred dollars (rather than several thousand dollars) yet which can still achieve point-for-point movement with the underlying shares (once below the breakeven price.

Wow, this sounds great!  Gee, I hope it works out.  Ah, there’s the rub.  No matter how “perfectly aligned the stars” seem to be, no trade is ever certain to generate a profit (I hate that part about trading).  Hence the reason a measured risk option trade makes a lot of sense.

Finally, just remember that this is an “example” of something, not a “recommendation”.

Jay Kaeppel
 

Jay’s ‘Energetic Market Shoppers’ System

In my previous article I wrote about a simple “system” – if you can even call it that – that involves buying retailing stocks four months out of the year and holding cash the rest of the year.  As ridiculously simple as that sounds the fact of the matter is that if you earned just 1% of annualized interest while out of retailing stocks, the system outperformed a buy-and-hold approach by a fairly wide margin.

While the results of that simple system aren’t bad, as always, one can’t help but to look for ways to improve things.  So this article will detail what I refer to as – and by the way, this is what I sound like when I refer to myself in the third person – “Jay’s Energetic Market Shoppers” System, or JEMS (clever, no?) for short.  The name is derived from the investment vehicles involved:

1. stands for, well, OK, Jay….

2. E stands for “Energetic”: Energy stocks have showed a historical tendency to rally in the spring so we will hold Fidelity Select Energy (ticker FSENX) during the month of April (other possibilities include tickers XLE and ENPIX).

3. M stands for “Market”: The stock market tends to perform well during November, December and January.  We are already planning to hold retail stocks during November, but for December and January we will hold an S&P 500 index fund.  For the purposes of this test we will use the S&P 500 Index itself from 1988 into 1997.  From there we will use the ETF ticker SPY.  Someone who wanted to keep it all in the Fidelity family could use ticker VFINX. (Another possibility is ticker BLPIX).

4. S is or “Shoppers”: Just as with the original system, we will hold Fidelity Select Sector Retailing (ticker FSRPX) during February, March, October and November (other possibilities include tickers XLY and CYPIX).

During May, June, July, August and September we will hold cash.

So here is the “lineup”

January                SPY

February              FSRPX

March                   FSRPX

April                       FSENX

May                       Cash

June                      Cash

July                        Cash

August                  Cash

September         Cash

October               FSRPX

November          FSRPX

December           SPY

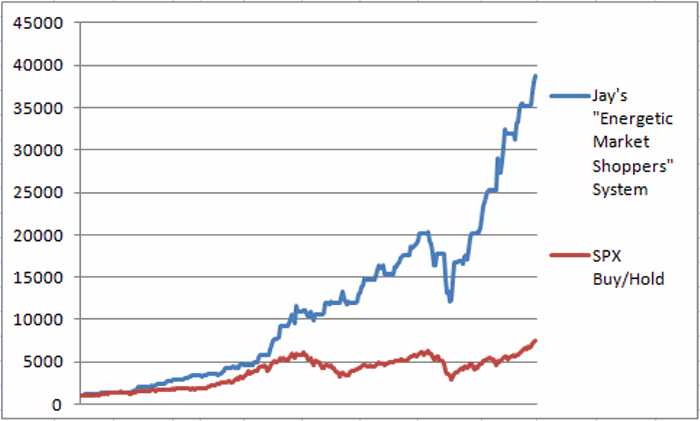
So how does it work out?  Not too badly.  Figure 1 displays the growth of $1,000 using the JEMS System versus buying and holding the S&P 500.  jotm20140129-01Figure 1 – Growth of $1,000 using “Jay’s Energetic Market Shoppers” System versus buying and holding the S&P 500 since 1988.

Figure 2 displays the year-by-year results.

JEMS

S&P 500


JEMS

S&P 500

Annual %

Annual %

Difference

$1,000

$1,000

1988

25.4

12.4

7.0

1,254

1,124

1989

12.4

27.3

(27.6)

1,410

1,430

1990

12.2

(6.6)

28.7

1,582

1,336

1991

36.6

26.3

(9.4)

2,161

1,688

1992

27.7

4.5

16.6

2,760

1,763

1993

10.5

7.1

(0.1)

3,050

1,888

1994

10.5

(1.5)

0.7

3,369

1,859

1995

8.1

34.1

(31.1)

3,642

2,493

1996

19.5

20.3

(2.1)

4,353

2,998

1997

14.2

31.0

(18.4)

4,970

3,927

1998

50.5

26.7

14.3

7,479

4,975

1999

42.4

19.5

(7.9)

10,652

5,946

2000

(2.4)

(10.1)

19.4

10,400

5,343

2001

15.6

(13.0)

16.8

12,027

4,646

2002

3.5

(23.4)

36.9

12,450

3,561

2003

10.5

26.4

(16.6)

13,755

4,500

2004

18.9

9.0

4.6

16,354

4,905

2005

(1.1)

3.0

6.2

16,182

5,052

2006

14.8

13.6

(3.7)

18,574

5,740

2007

2.4

3.5

(5.3)

19,027

5,943

2008

(30.4)

(38.5)

7.0

13,237

3,656

2009

33.2

23.5

1.0

17,635

4,513

2010

32.5

12.8

14.0

23,366

5,090

2011

17.2

(0.0)

14.0

27,381

5,090

2012

21.3

13.4

4.7

33,204

5,772

2013

16.7

29.6

(18.2)

38,752

7,481


Average

16.3

9.6

1.3

StdDev

16.1

17.9

Ave/SD

1.011

0.540

Figure 2 – Year-by-Year Results

For the record:

-The JEMS System sported an average annual gain of +16.3%

-Buy/Hold sported an average annual gain of +9.6%

-$1,000 invested using the system grew to $38,752

-$1,000 invested using Buy/Hold grew to $7,481

-The JEMS system showed a gain in 23 of 26 calendar years (88.5%)

-The JEMS system showed a loss in 3 of 26 calendar years (12.5%)

-Buy/Hold showed a gain in 19 of 26 calendar years (73.1%)

-Buy/Hold showed a loss in 7 of 26 calendar years (26.9%)

-JEMS outperformed Buy/Hold in 15 of 26 calendar years (57.7%)

-Buy/Hold outperformed JEMS in 11 of 26 calendar years (42.3%)


Summary

So is the JEMS System the “world beater” system that everyone should be using?  Well, on the plus side the long-term results are impressive relative to buy and hold.  On the downside, there is still the sharp drawdown of 2008 that one would have had to continue to trade through.  Also, the reality is that for most investors, a system like this involves more of a “leap of faith” than they are comfortable with.

Of course, as a proud graduate of “The School of Whatever Works” and as a founding member (OK, so far the only member) of “Seasonalaholics Unanimous!”……

………that’s just the way I like it.

Jay Kaeppel


Attention Shoppers! Part I

Hi, my name is Jay and I am a Seasonalaholic.  Now typically when someone confesses to being an “aholic” of some sort or another it because they recognize they have a problem and wish to correct it.  That’s not the case here.  In fact the “support” group that I belong to is not “Seasonalaholics Anonymous” but rather “Seasonalaholics Unanimous!” (OK, in the interest of full disclosure, so far I am the only member and yes, the monthly meetings aren’t terribly lively, but I digress).

Still I can’t help but think there are others out there who might join someday – especially after they consider things like the seasonal tendencies for retailing stocks.  To whit: what would have happened had an investor invested in Fidelity Select Sector Retailing fund (ticker FSRPX):

-During the months of February, March, October and November

-And then earned 1% of annualized interest while out of the market the other 8 months.

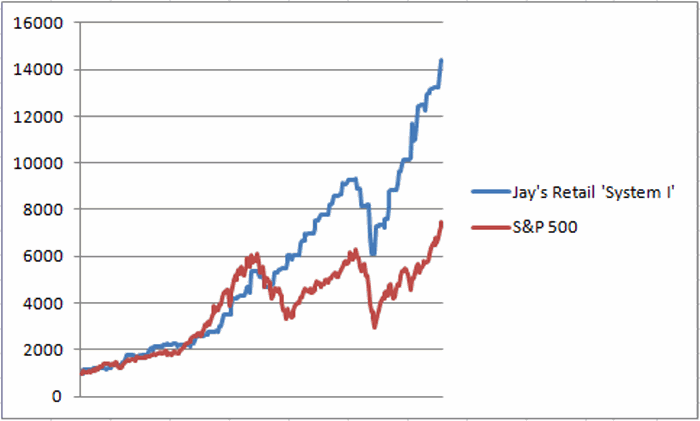
The answer is contained in Figure 1 which displays the growth of $1,000 invested as described above.

jotm20140127-01Figure 1 – Growth of $1,000 invested in FSRPX during February, March, October, November (blue line) versus buying and holding the S&P 500 red line) since January 1988.

Now it is pretty impossible to not notice the, ahem, “slight drawdown” experienced during the October, November 2008 period.  Still, despite the fact that I have tried very hard scrub that particular time period from my memory bank, I still have some vague recollection that virtually no sector of the stock market was left unscathed during that period.  And the rebound has been pretty nice.

So is this really a viable strategy?  Well, under the category of “Everything is Relative”, Figure 2 displays the year-by-year performance of this “system” versus buying and holding the S&P 500.

System S&P 500   System S&P 500
Annual % Annual % Difference

$1,000

$1,000

1988

18.6

12.4

6.2

1,186

1,124

1989

(1.0)

27.3

(28.2)

1,174

1,430

1990

21.3

(6.6)

27.8

1,424

1,336

1991

16.2

26.3

(10.1)

1,654

1,688

1992

20.4

4.5

15.9

1,992

1,763

1993

6.2

7.1

(0.9)

2,115

1,888

1994

(1.5)

(1.5)

0.0

2,083

1,859

1995

2.3

34.1

(31.8)

2,131

2,493

1996

17.4

20.3

(2.9)

2,500

2,998

1997

11.9

31.0

(19.1)

2,798

3,927

1998

40.1

26.7

13.4

3,919

4,975

1999

10.8

19.5

(8.7)

4,344

5,946

2000

8.5

(10.1)

18.7

4,714

5,343

2001

3.1

(13.0)

16.1

4,859

4,646

2002

12.8

(23.4)

36.2

5,480

3,561

2003

9.1

26.4

(17.3)

5,977

4,500

2004

12.8

9.0

3.8

6,744

4,905

2005

8.5

3.0

5.5

7,316

5,052

2006

9.2

13.6

(4.4)

7,991

5,740

2007

(2.4)

3.5

(6.0)

7,797

5,943

2008

(32.0)

(38.5)

6.5

5,303

3,656

2009

23.7

23.5

0.2

6,559

4,513

2010

26.0

12.8

13.2

8,263

5,090

2011

13.2

(0.0)

13.2

9,355

5,090

2012

17.3

13.4

3.9

10,976

5,772

2013

10.7

29.6

(18.9)

12,155

7,481

 
Average

10.9

9.6

1.3

 +1,115% +648%
StdDev

12.8

17.9

Ave/SD

0.849

0.540

Figure 2 – “System” versus S&P 500 Buy and Hold


Summary

The difference in the average annual return is not large (+10.9% for the system versus +9.6% for the S&P 500).  But this difference adds up over time.  Since January 1988 the system has gained +1,115% versus + 648% for the S&P 500 (while only being in the market 33% of the time. The true “numbers geeks” will notice that the standard deviation of annual returns for the system is only 2/3rds as large as that for the S&P 500 – i.e., much less volatility).

So I ask again, is this really a viable strategy?  Perhaps.  But the truth is that it can get a whole lot better – as I will detail the next time I write.

Jay Kaeppel

A ‘Light’ Trading System to Trade Options

There are a virtually unlimited number of ways to play the financial markets.  This is especially true in the area of options trading, where a bullish trader can pick from at least at a dozen different strategies (buy call, buy a bull call spread, sell a bull put spread, collar, out-of-the-money calendar spread, etc., etc.).

At some point it can all become a bit overwhelming to the quote, unquote, “average investor.”  So sometimes the place to start is, well, anywhere, so long as that anywhere has a beginning and an end and a logical progression to it.  What does that mean?  It means I am going to walk through “one way to play.”  I make no claim that it is the “best” way, or even a “great” way.  But that’s OK because the purpose here is not for you to rush out and start trading with it, but rather to stimulate your own thinking on the subject.  In other words, hopefully in reading this a “light” will go on for you in regards to your own trading.  So here goes.


Jay’s “Light” Option Trading Strategy

This strategy involves a set of steps designed to generate a bullish option trade based on a logical set of criteria.

For this strategy we will look for a couple of things:

1. A “catalyst” to tell us when to buy call options.

2. Stocks that enjoy good option trading volume and tight bid-ask spread.

3. Stocks that are performing well overall.

4. Stocks that have experienced a recent pullback and may now be due for a bounce.


#1. The “Catalyst”

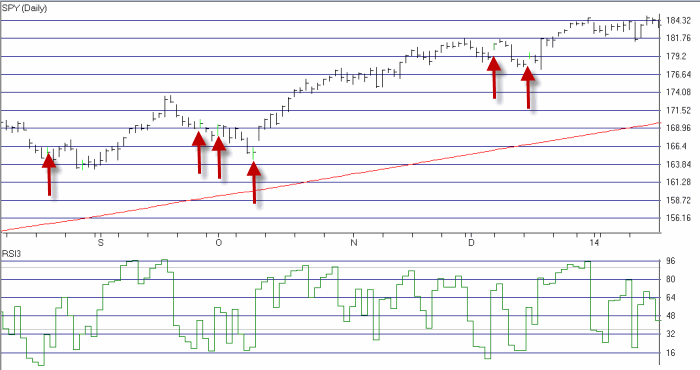
We will look for ticker SPY to be above its 200-day moving and for the 3-day RSI to drop to 20 or below and then reverse to the upside.  Figure 1 displays a number of such signals.

jotm20140121-01 Figure 1 – “Catalyst” Buy Signals (Courtesy AIQ TradingExpert)


#2. Stocks with good option volume and tight bid/ask spreads.

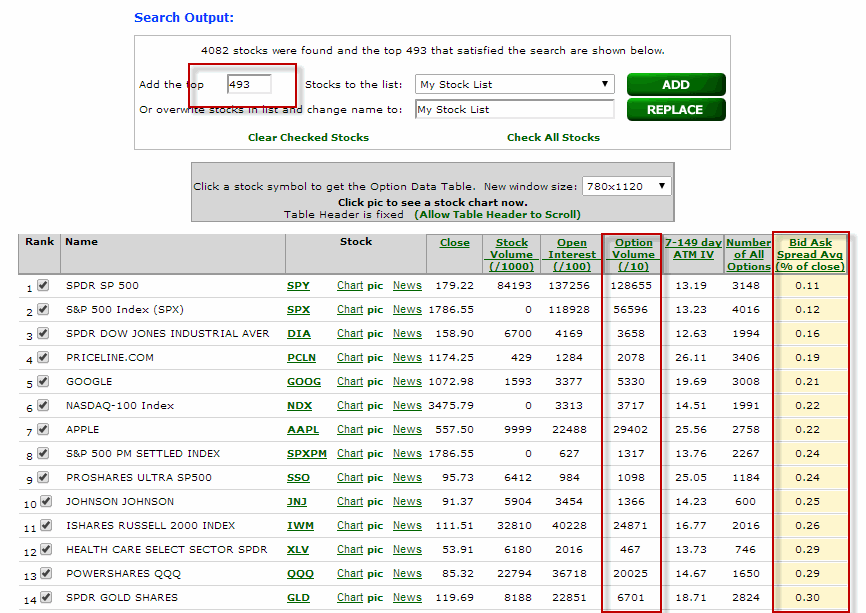
In Figure 2 we see the “Stock List Filter” report from www.OptionsAnalysis.com.  This list contains 493 stocks that trade at least 1,000 options a day and those options have an average bid/ask spread of less than 2% (only the top part of the list is visible in Figure 2).jotm20140121-02 Figure 2 – Stocks with good option volume and tight bid/ask spreads (Courtesy: www.OptionsAnalysis.com)


#3. Stocks that are performing well overall

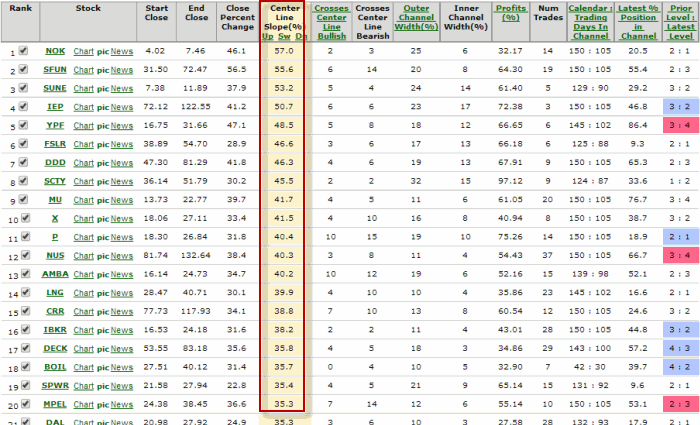
Next we take the stocks shown in Figure 2 and run them through the “Channel Finder” routine in www.OptionsAnalysis.com.  We will look for the top 100 stocks based on the strength of their “Up Channel”.   We overwrite “My Stock List” with just those 100 stocks.  The output list appears in Figure 3. jotm20140121-03

Figure 3 – Stocks with best UP Channel (Courtesy: www.OptionsAnalysis.com)

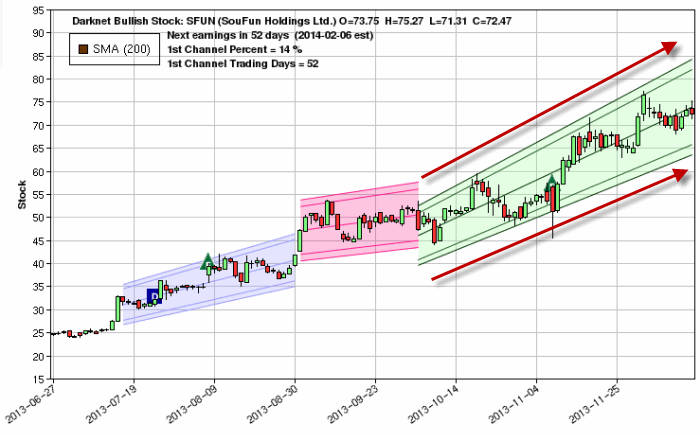
In Figure 4 we see ticker SFUN with a very strong recent Up Channel jotm20140121-04Figure 4 – Ticker SFUN with Up Channel (Courtesy: www.OptionsAnalysis.com)


#4. Stocks that have experienced a “pullback”

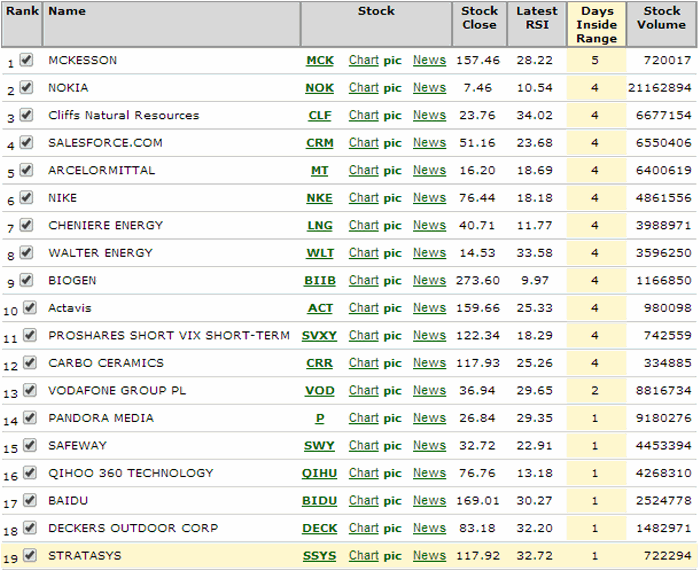
Lastly, we will look through the 100 stocks still on our list for those that have experienced a 3-day RSI of 35 or less within the past 5 trading days.  As you can see in Figure 5, only 19 stocks now remain for consideration.jotm20140121-05Figure 5 – Stocks that have had a 3-day RSI reading of 35 or less in past 5 days (Courtesy: www.OptionsAnalysis.com)


The Next Step: Finding a Trade

From here a trader can use whatever bullish option strategy they prefer to find a potentially profitable trade among these 19 stocks.  For illustrative purposes we will:

-Consider buying calls with 45 to 145 days left until expiration and Open Interest of at least 100 contracts.

-Initially sort the trades by a measure known as “Percent to Double”, as in “what type of percentage move does the underlying stock have to make in order for the option to double in price?”

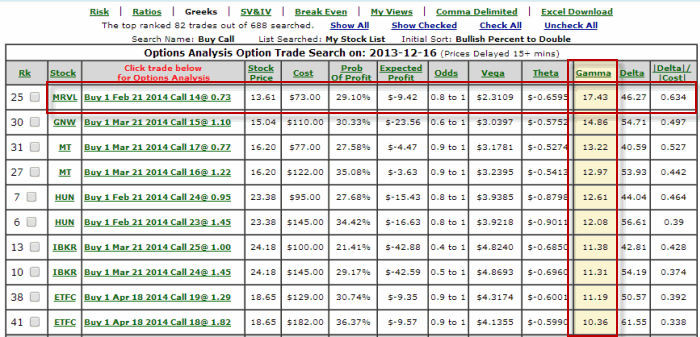
-Once we get that list e will sort by “Highest Gamma” in an effort to get the most “bang for the buck.”

We see the output list in Figure 6. jotm20140121-06

Figure 6 – Trades sorted by “Bullish % to Double, then by Highest Gamma” (Courtesy: www.OptionsAnalysis.com)

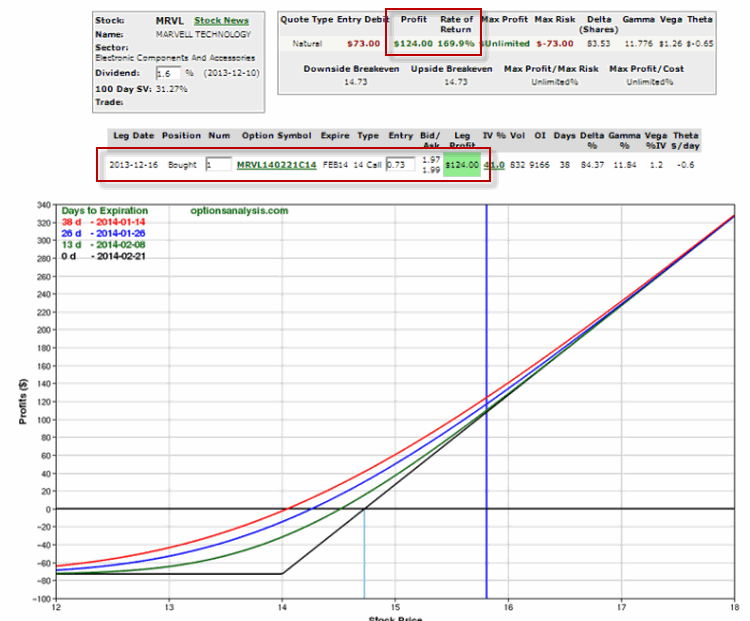
The top trade listed in to buy the MRVL Feb 2014 14 Call @ $0.73 (or $73 per option)

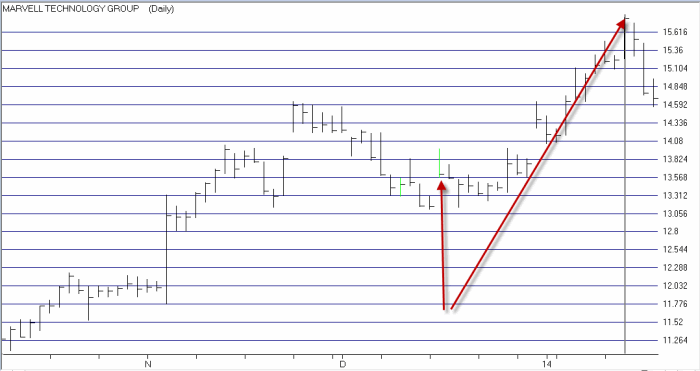
In Figure 7, we see that MRVL rallied nicely within a few weeks from 13.61 to 15.81.jotm20140121-07Figure 7 – MRVL rallies (Courtesy: www.OptionsAnalysis.com)

In Figure 8 we see that the Feb 14 call option gained 169.9%.jotm20140121-08 Figure 8 – MRVL 14 call rallies sharply (Courtesy: www.OptionsAnalysis.com)

Of course there is also the whole topic of what to do with this trade: close it, sell some, adjust it, etc.  Sorry folks, that’s  beyond the scope of this article.


Summary

So does every trade work out this well?  That reminds me of a joke.  A salesman rings he doorbell of a home and a 12–year old boy answers the door.  The boy has a beautiful woman on each side, a drink in one hand and a big cigar in his mouth.  Momentarily stunned the salesman finally manages to ask hesitantly, “Um, is your mother home?”

The boy removes the cigar from his mouth, looks straight at the salesman and asks, “What do you think?”

Same answer here.

Still, a logical set of steps is a good place to start.

If you are interested in a Promo Code for www.OptionsAnalysis.com, please leave a comment to that effect on my blog

Jay Kaeppel


A ‘Dark’ Trading System to Trade Options

For the record, I am one of those guys who typically likes to develop his own trading methods.  Call it pride, stubbornness, or just plain paranoia, but I like to know that the any method I may use fits with my own personality.  Of course, it is still important to keep an open mind and to consider new ideas when they pop up in front of you.  One that I like a lot is a trading method developed by a former colleague of mine.  His name is John Broussard and he is the developer of www.OptionsAnalysis.com

John developed a system called “Darknet” for trading stocks and/or options based on his own proprietary trading logic.  John was kind enough to share the trading logic with me.  I am not at liberty to disclose it here (partly because I am still not entirely sure I understand what he was talking about.  Which come to think of  it, is probably why he was comfortable sharing the logic with me in the first place.  But I digress).

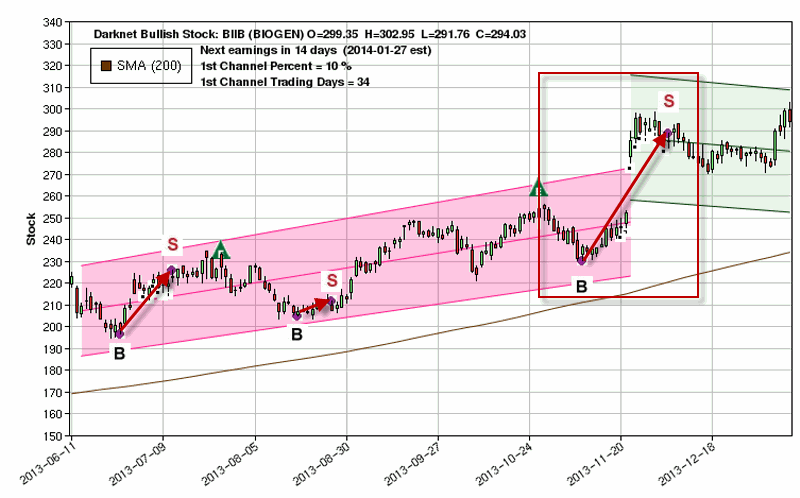
In any event, while a few of the calculations, ahem, “push my limits of understanding”, I understand the concept well enough and have explored it enough to start following signals on a small list of stocks and indexes that I follow.  To put it as succinctly as possible, Darknet looks for “several sets of regression channels to line up” in order to generate a trading signal.  The reason the name is Darknet is because the criteria used to generate the signals is not visible to the human eye just from looking at a standard bar chart.

In any event, following a “buy” signal I look for a call option to purchase using the “% to Double” routine at www.OptionsAnalysis.com.  The call option ostensibly is held until the system generates a “sell” (as in, exit a long position, not enter a short position). Since I only follow a handful of tickers there are not a lot of signals, but for illustrative purposes let me highlight a recent signal.

Ticker BIIB

Figure 1 displays three recent buy and sell signal generated by Darknet for ticker BIIB.  jotm20130113-01

Figure 1 – Darknet signals for ticker BIIB (courtesy www.OptionsAnalysis.com)

Let’s take a look at entering an option trade for the most recent signal at the far right hand side of Figure 1.  Figure 2 displays the output from the % to Double routine.  The first trade listed is the December 2013 240 call, which has 42 days left until option expiration.  A person who wanted to be more conservative could buy the third option listed – the January 2014 240 call option – which has 70 days left until option expiration.  jotm20130113-02

Figure 2 – BIIB Call trades ranked buy Bullish % to Double (courtesy www.OptionsAnalysis.com)

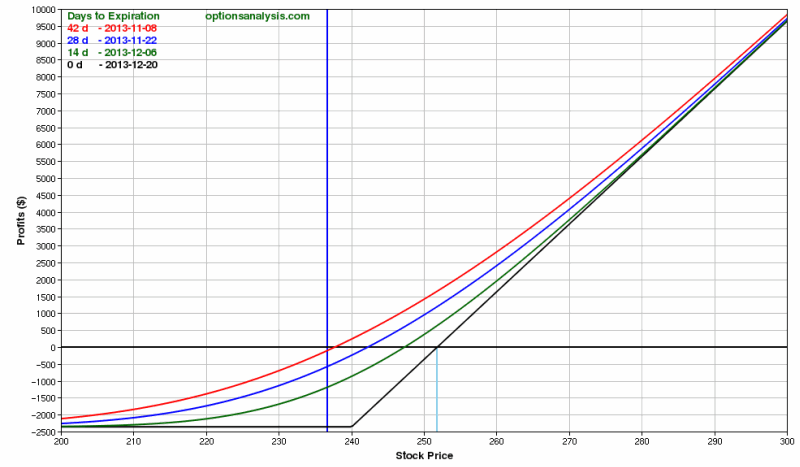
Let’s say we were willing to commit up to $2,500 to a trade and are comfortable trading the option with only 42 days left until expiration rather than the one with 70 days left.  The risk curves for this trade – buying 2 of the December 240 call – appear in Figures 3 and 4. jotm20130113-03 Figure 3 – BIIB December 240 Call (courtesy www.OptionsAnalysis.comjotm20130113-04

Figure 4 – Risk Curves for BIIB December 240 Call (courtesy www.OptionsAnalysis.com)

As with any long call position, the underlying security ultimately must rise in price in order for the trade to make money.  Also, time decay begins to accelerate in the month before expiration and this option has only 42 days left until expiration when the position is entered.  So the bottom line is that in this example, if BIIB does anything other than rally in the reasonably near future, the trade stands to lose money.

The Result

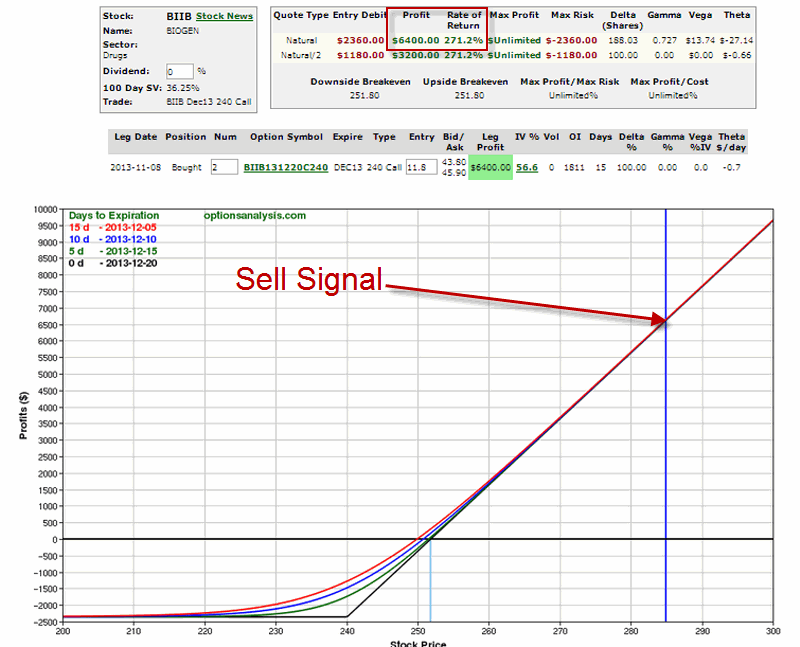
Well you didn’t think I was going to show you a losing trade, did you?  With a glance back at Figure 1 we see that BIIB rallied and that a sell signal was generated on 12/5/13.  At this point, the trade I highlighted could have been exited with a profit of +271.2% as shown in Figure 5.  Needless to say, not every trade works out as well as this one.  Still, it does grab one’s attention regarding the possibilities.

jotm20130113-05 Figure 5 – BIIB December 240 call at time of Darknet sell signal (courtesy www.OptionsAnalysis.com)

Don’t Forgot about Alternative Endings

In my analysis, the raw buy and sell signals from Darknet – in highly technical terms that we quantitative types like to throw around – “look pretty darn good” to me.  Of course, as with any trading method no trade or series of trades is certain to generate a profit.  So traders still must engage in the same old mundane and boring risk management (i.e., position sizing) and position management (i.e., when to exit with a profit, when to exit with a loss and when to consider adjusting a trade).

Which leads to one last point, remember that when you trade options you don’t necessarily have to “wait around for a sell signal.”  In many cases there can be opportunities to adjust an existing position in order to lock in profits and/or reduce risk.  As always, there are a lot of way to play.

If you are interested in receiving a Promo Code for www.OptionsAnalysis.com please leave a comment on my blog.

Jay Kaeppel


A Handy List for Option on ETF Traders

Focus is important.  Hey look, a squirrel!  OK, I’m sorry, what was I saying?  Well in any event, one thing I constantly tell people is that there has never been a better time to be a trader.  For one thing, the advent of ETFs has opened up a world of opportunity for investors and traders across a wide variety of investment categories.  In addition, options on ETFs allows traders to implement many strategies – and take advantage of  numerous opportunities – at a fraction of the cost involved in trading ETF shares themselves.

Ironically, the good news and the bad news for traders are one and the same.  The good news is that there are so MANY OPPORTUNITIES available now.  The bad news is that there are SO MANY opportunities available now.

Every day it seems like new ETF’s are coming out covering some even more arcane, previously not covered investment area.  You will know its peaked when they come out with the “Alphabet ETF Series”.  Can’t you see it coming?  For example:

*iProWisdomShareSPDRexion “A Name Fund” which trades every stock whose company name starts with the letter “A”.

*iProWisdomShareSPDRexion “A Ticker Fund” which trades every stock whose ticker name starts with the letter “A”.

(OK, in the interest of full disclosure I am sort of looking forward to owning a few shares of the “J” Fund)

So on and so forth until they get through “Z”.  Then come the leveraged, inverse and sector funds (Energy A, EnergyB, etc)……..The marketing people are staying up late my friends.

OK back to focusing:

To aid in the effort of helping traders to focus, please see the table in Figure 1 below.  There is really nothing earth shattering or ground breaking about this list, but it does provide a handy list of the ETFs in a variety of categories that have the most option trading volume.

If you narrow it down even more to just those tickers that are bolded, chances are you will find more opportunities than you can use.  The bottom line – if you can’t find some option trading opportunities here, you probably should not trade options.


Category ETF Name Ticker Ave. Option Volume
US Stock Index  SPDR SP 500 SPY 1,448,449
US Stock Index  POWERSHARES QQQ QQQ 319,211
US Stock Index  ISHARES RUSSELL 2000 INDEX IWM 284,749
US Stock Index  SPDR DOW JONES INDUSTRIAL AVER DIA 70,403
US Stock Index  WisdomTree Japan Hedged DXJ 39,030
US Stock Index  DIREXION DAILY SMALL CAP BULL TNA 16,407
US Stock Index  DIREXION DAILY SMALL CAP BEAR TZA 13,466
US Stock Index  PROSHARES ULTRASHORT SP500 SDS 12,111
US Stock Index  PROSHARES ULTRA SP500 SSO 7,771
Int’l Stock Index  ISHARES MSCI EMERGING MARKETS EEM 246,173
Int’l Stock Index  ISHARES FTSE CHINA 25 INDEX FU FXI 121,235
Int’l Stock Index  ISHARES MSCI BRAZIL INDEX EWZ 44,995
Int’l Stock Index  ISHARES MSCI EAFE INDEX EFA 44,297
Int’l Stock Index  ISHARES MSCI JAPAN INDEX EWJ 10,524
Int’l Stock Index  ISHARES MSCI MEXICO INVESTABLE EWW 7,819
Int’l Stock Index  SPDR EURO STOXX 50 FEZ 6,698
Currencies  CURRENCYSHARES JAPANESE YEN TR FXY 7,591
Currencies  CURRENCYSHARES EURO TRUST FXE 6,304
Currencies  POWERSHARES DB US DOLLAR INDEX UUP 4,089
Sectors  MARKET VECTORS GOLD MINERS ETF GDX 92,632
Sectors  CONSUMER STAPLES SELECT SECTOR XLP 81,675
Sectors  FINANCIAL SELECT SECTOR SPDR XLF 80,477
Sectors  ENERGY SELECT SECTOR SPDR XLE 25,503
Sectors  ISHARES DOW JONES US REAL ESTA IYR 25,320
Sectors  UNITED STATES NATURAL GAS UNG 25,101
Sectors  DIREXION DAILY FINANCIAL BULL FAS 22,501
Sectors  SPDR SP HOMEBUILDERS XHB 18,717
Sectors  HEALTH CARE SELECT SECTOR SPDR XLV 17,088
Sectors  SPDR SP OIL GAS EXPLORATION XOP 16,123
Sectors  MATERIALS SELECT SECTOR SPDR XLB 14,505
Sectors  COMMONWEALTH REIT CWH 12,525
Sectors  UTILITIES SELECT SECTOR SPDR XLU 8,937
Sectors  NORTHSTAR REALTY FINANCE NRF 8,428
Sectors  TECHNOLOGY SELECT SECTOR SPDR XLK 8,266
Sectors  ANNALY CAPITAL NLY 8,213
Sectors  SPDR SP RETAIL XRT 6,054
Sectors  DIREXION DAILY FINANCIAL BEAR FAZ 5,180
Sectors  INDUSTRIAL SELECT SECTOR SPDR XLI 3,940
Sectors  SPDR SP METALS MINING XME 3,625
Sectors  ISHARES NASDAQ BIOTECHNOLOGY IBB 3,430
Commodity  SPDR GOLD SHARES GLD 99,983
Commodity  ISHARES SILVER TRUST SLV 56,076
Commodity  PROSHARES ULTRA SILVER AGQ 5,560
Bond  ISHARES BARCLAYS 20+ YEAR TREA TLT 44,048
Bond  ISHARES IBOXX $ HIGH YIELD COR HYG 24,855
Bond  PROSHARES ULTRASHORT 20+ YEAR TBT 22,436
Bond  ISHARES BARCLAYS 7-10 YEAR TRE IEF 5,988

Figure 1 – ETFs with active option trading volume

Remember, there are likely more opportunities available on this list than you can possibly use.

So let’s focus, people!

Jay Kaeppel


Jay’s Simple Momentum Sector Fund System

Please see my new article in Technical Analysis of Stocks & Commodities magazine titled “New Tricks With Old Indicators” (http://traders.com/) On Sale Now.

Please find below a complimentary link from MTA (Market Technicians Association) my webinar titled “Finding Exceptional Opportunities with ETF, Options and Seasonal Trends.

http://go.mta.org/watch112013

If there is one is universally true statement that I can make about trading systems in general and in specific, it is this – they sure are fun when they work.

When I first started trading – back in what I longingly refer to as the “Hair Era” in my life – I figured that I would be a “gut” trader – i.e., I was determined to rely on my keen instincts and intuitive reasoning to decide when to buy and sell based on current market conditions.

That was not fun.  After continually getting sucked into the swirling vortex of emotion – not to mention the abject fear associated with seeing  your money disappear – I found that I was getting the, um, back of my front so to speak, burned so many times that I was having difficulty, um, sitting down, so to speak.

Eventually I evolved into a systematic trader.  Now I am able to sit down much more often.  A few strategies that I have developed over the years have stood the test of time and become something of “bread and butter” strategies.  And they sure are fun when they work.  To wit….


Jay’s Pure Momentum System

In 2001, I published an article in “Technical Analysis of Stocks and Commodities” magazine titled “Trade Sector Funds with Pure Momentum”, which detailed one specific and simple trading method.  While in fact this is only one of many sector trading systems that I have developed over the years – and not necessarily the best one – it remains one of my favorites.  Probably because it is just so gosh darn simple.  When I was young my Momma told me to be a simple kind of man (or was it a Freebird she told me to be?).  Well, in any event, here are the “simple kind of rules” using Fidelity Select Sector funds:

-After the close of the last trading day of the month identify the five Fidelity Select Sector funds that have the largest gain over the previous 240 trading days.

-For this system, ignore Select Gold (ticker FSAGX).  If FSAGX appears in the top 5 funds then skip it and include the 6th highest rated funds.

-If fewer than five funds showed a gain over the previous 240 trading days, then hold cash in that portion of the portfolio (i.e., if only 3 funds showed a gain, then 60% of the portfolio would be in those funds and 40% of the portfolio would be in cash).

-If you sell more than one fund at the end of a month, then rebalance the proceeds in the new funds being purchased (example, you are selling Funds A and B and buying Funds C and D.  You have $12,000 in Fund A and $10,000 in Fund B.  Split the difference and put $11,000 each into funds C and D).

And that’s all there is to it.


The Results

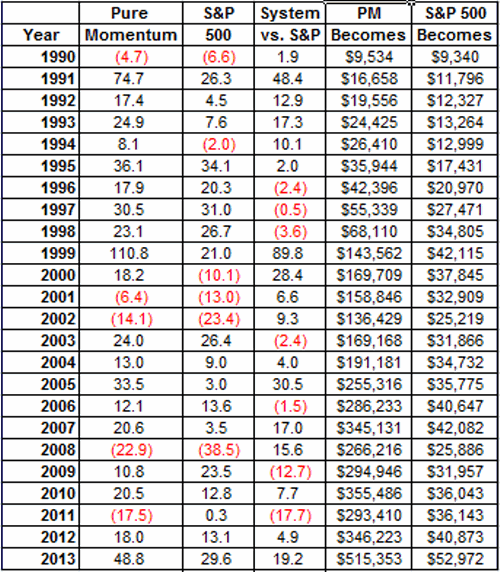
Figure 1 displays the annual results of this method. jotm20140106-01

Figure 1 – Jay’s Pure Momentum Annual Results

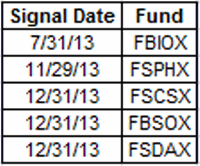
Figure 2 displays the current portfolio.

jotm20140106-02

Figure 2 – Jay’s Pure Momentum Current Portfolio

My opinion as to why this system has performed well over the years is, well – what else – simple.  The effects of a positive change in the fundamentals for a given industry or sector typically take a long time to play out.  Thus, by finding the sectors that are performing well you very often find the sectors that are most likely to continue to perform well for a while.

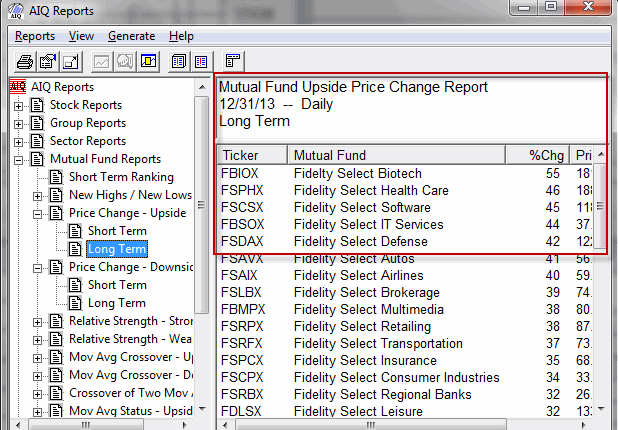
jotm20140106-03 Figure 3 – 12/31/13 Test (Courtesy: AIQ TradingExpert) JOTM20140106-04

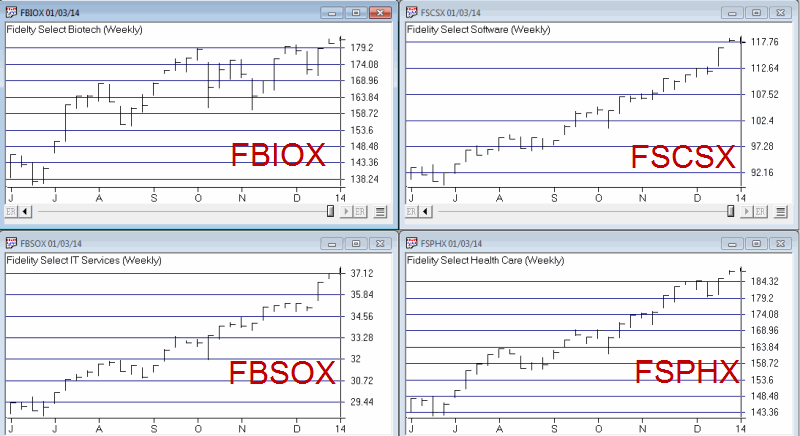
Figure 4 – Several Current Sector Fund Holdings (Courtesy: AIQ TradingExpert)


Summary

Obviously 2013 was a banner year for this system.  There is nothing like a rip roaring bull market to help things along.  A couple of caveats:

*First off, sometimes people new to momentum investing will look at the charts in Figure 4 and say “Whoa, these things have already rallied sharply, I’m not jumping into those.”  That’s something you’ll have to get over to use this system.

*Secondly, while the long-term yearly numbers look pretty good, there was about a 45% drawdown along the way in 2008.  So it is not for the faint of heart.

*One other danger is that some people see +48.8% for the year in 2013  and get it in their head that this will occur again often.  History suggests otherwise. 

Still, an average annual return of +20.7% since 1990 (versus +8.9% for the S&P 500) isn’t bad – especially for a “Simple Kind of System.”

Best of Good Fortune in 2014.

Jay Kaeppel

Bonds are to Fear Early in the Year

Please see my new article in Technical Analysis of Stocks & Commodities magazine titled “New Tricks With Old Indicators” (http://traders.com/) On Sale Now.

The treasury bond market has showed a strong seasonal tendency to perform poorly during the early part of the year.  People often ask me “why” this would be so.  In fact I get that question often enough to make me wish I had a good answer.  Alas, as a proud graduate of “The School of Whatever Works”, I can only repeat our school motto, which is “Whatever!”

Two Early Year Trends in T-Bonds: Part 1

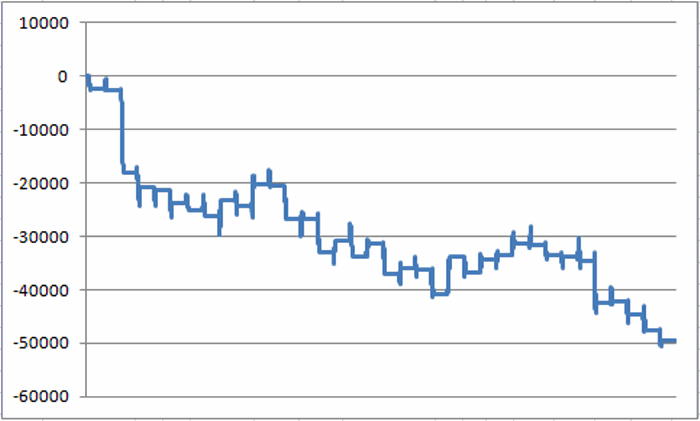
First let’s look at the performance of t-bond futures between the end of the first trading day of the new year and the 14th trading day of February starting in 1978.  Figure 1 displays the performance achieved by an (extremely stubborn and not terribly astute) investor who held a long position in t-bond futures during this time period every year. jotm20140102-01Figure 1 – Long t-bond futures from on January Trading Day 1 through February Trading Day 14 (1978-present)

All told, the loss came to -$49,511 (excluding any slippage and/or commissions).  Of course, like all seasonal trends there is never any guarantee that the trend will hold true the next time around.  For the record the Jan TD 1 through Feb TD 14 period saw T-bonds:

-Gain 10 times

– Lose 25 times

-Breakeven 1 time

Each point movement in t-bond futures is worth $1,000

-The median gain during up years was +$2,234

-The median loss during down years was -$2,406

-The largest gain was $6,937 in 2000.

-The largest loss was -$15,281 in 1980.

So basically, t-bonds gained 28% of the time, and lost or broke even 72% of the time, and the median loss was slightly greater than the median gain.


Two Early Year Trend in T-Bonds: Part 2

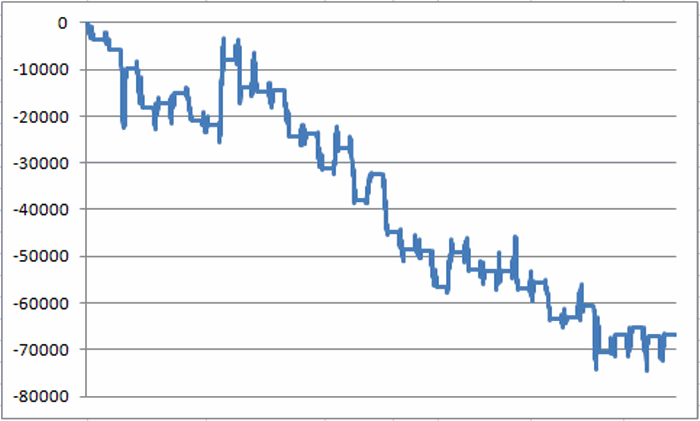
Let’s look next at the net performance for t-bonds during the first four months of the calendar year.  Typically, after bonds sink into mid-February there is a bounce in the second half of February.  But for our test we will just consider the results achieved by holding a long position in t-bonds from December 31st each year through the end of April.  These results appear in Figure 2. jotm12130102-02Figure 2 – Long t-bond futures December 31st through April 31st

All told, the loss came to -$66,389 (excluding any slippage and/or commissions).  Of course, like all seasonal trends there is never any guarantee that the trend will hold true the next time around.  For the record the Dec 31st to Apr 30th period saw T-bonds:

-Gain 16 times

– Lose 20 times

Each point movement in t-bond futures is worth $1,000

-The median gain during up years was +$1,797

-The median loss during down years was -$4,813

-The largest gain was $13,968 in 1986.

-The largest loss was -$11,313 in 1994.

In reality, the January through April time frame has seen t-bonds show a loss only 56% of the time.  So this trend is absolutely by no means a sure thing, so the one thing you should absolutely not do is get it in your head that t-bonds are bound to decline between now and the end of April.

The key thing to note regarding this trend is that the median “down” year has witnessed a decline that is 2.7 times larger than the median gain shown during the “up” years.  So the key is simply to recognize the potential danger.


Summary

With t-bonds presently quite oversold, it is a little difficult to jump on the bearish bandwagon at the moment (in fact, bonds are rallying nicely as I write here on the first trading day of the year).  And as I have tried to make clear, a decline in t-bond prices during either of both of the highlighted periods is by no means a sure thing.  Still, this little bit of history suggests that getting wildly bullish on t-bonds may not be the best strategy.

Jay Kaeppel