Monthly Archives: October 2013

Mommy, Why Do They Call October “Crash Month”?

Despite what the headline says, this is not one of those “Gloom and Doom” or “Sell Everything” articles.  It simply serves to remind that this is not the worst time in the world to think about hedging your stock portfolio.  First off, in case you have been tied up for the past 48 hours attempting to sign up for Obamacare, simply note that it is now the month of October.  Now over the long-term the stock market has actually gained ground during October.  But there is a reason that people refer to it as “Crash Month”.  A number of stock market, um, “declines”, both large and “merely painful” have played out in the past during October.

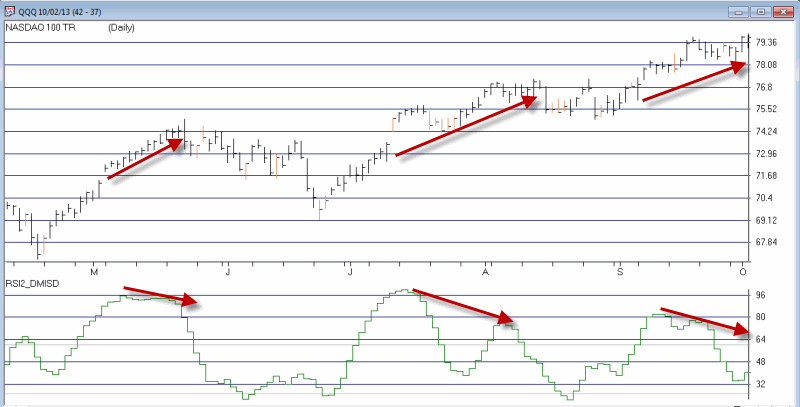
Will this be “one of those Octobers?”  Probably not, but…….for those who hold some belief in “The Power of the Negative Divergence”, there is some reason for concern.  In Figure 1 you see ticker QQQ which tracks the Nasdaq 100.  On 10/1 it closed at a new multi-year high.  Whoohoo!  As a “go with the flow” kind of guy and as a big believer in the “power of the trend” please understand that I am not attempting to “call the top”.  I am merely pointing out the potential for a, ahem, “meaningful pullback.”

Under the bar chart in Figure 1, I have plotted an indicator I created (in truth I took two indicators from other people and simply mashed them together) called RSI2_DMISD.  Now if I could remember what that acronym stands for exactly I would tell you, but for now simply note that this indicator does a pretty good job of “negatively diverging” near tops.

20131003-01

Figure 1 – Negative Divergence between indicator and price action (courtesy: AIQ TradingExpert)

As you can see, RSI2_DMISD came nowhere close to making a new high on 10/1.  Does this mean the market is “doomed?”  Not at all.  But it does offer a word of caution.  In addition, in Figure 2 we see that while QQQ and IWM (that tracks the Russell 2000 small cap index both made new highs, the large cap indexes represented by ticker DIA and SPY did not.  This represents another form of bearish divergence.
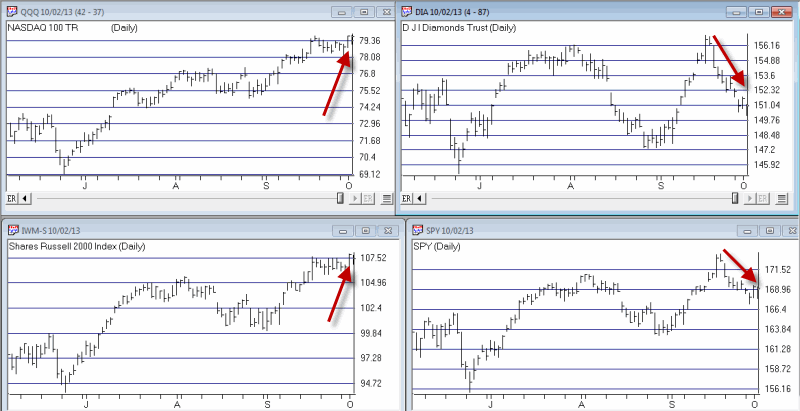
20131003-02 Figure 2 – Nasdaq and Small-Caps touch new high; Large-Caps not so much  (courtesy: AIQ TradingExpert)

Summary

As an avowed “trend follower” it is not in my nature to shout “sell everything”.  It is however, in my nature to shout “Hedge” every once in a while (and boy do I get some funny looks at the grocery store).  This is one of those times. 

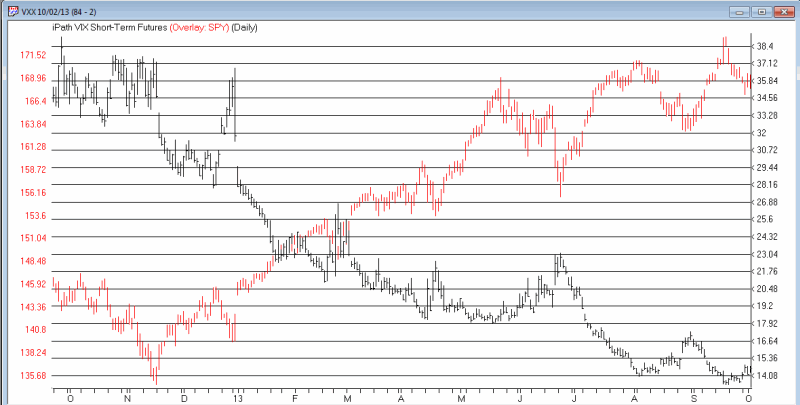
My favorite play is still to hold call options on ticker VXX which track the VIX Index.  In Figure 3, the VXX has not moved up much even as the S&P 500 has declined of late.  If anything “negative” happens during October we have every reason to expect VXX to “spike” higher. 

20131003-03

Figure 3 – VXX has room to move higher  (courtesy: AIQ TradingExpert)

If VXX were to merely bounce back up to its most recent high of 17.34, the November VXX 14 call would roughly double in price.  20131003-04
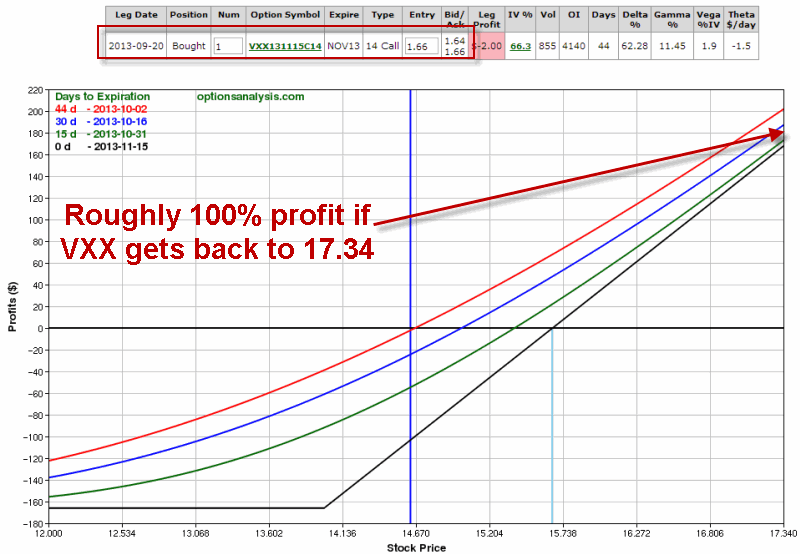
Figure 4 – VXX November 14 Call Option  (courtesy: www.OptionsAnaysis.com)

At $166 a contract, this represents a pretty good and inexpensive hedging opportunity.  On the flip side, if nothing “bad” happens during October, this option can be sold on October 31st to salvage some of the premium.

Jay Kaeppel
 

(Part II) Gold Stocks and the Month of October

In my last post (http://tinyurl.com/m8pdr5k) I pointed out that gold stocks (as measured using Fidelity Select Gold, ticker FSAGX) during the first 19 trading days of October have declined 17 times in the past 24 years (roughly 71% of time) with a net loss of -76.5%.  Now if you are like most people – myself included – your initial reaction may well be to assume that gold stocks will decline during October of 2013.  But the reality is that that is not necessarily the case.  It just means that in the past the odds have favored the gold stock bears during this time frame.

So the obvious question then becomes “what to do with this knowledge?” One possibility of course is to do nothing.  If you have no position in gold stocks right now perhaps you might just hold off for awhile.  Another possibility for more active traders is to attempt to play the short side. In this case the questions are slightly different from my last post.  They are:

1. Which specific trade will I take to play the short side of gold stocks?

2. How much capital will I allocate?

One “exciting” possibility is to buy ticker DUST, the triple leveraged inverse gold stock ETF.  And when I say “exciting” I mean like “bungee jumping off a bridge kind of exciting”, which is also to say “it is definitely not for everyone. ” In this case, the words “exciting” and “dangerous” are essentially interchangeable.  To illustrate consider this:

In yesterday’s table the “worst performing” (for a person playing the short side of gold stocks) first 19 trading days of October was 1993 when gold stocks rallied +14.5%.  So in theory, a person holding a triple leveraged inverse gold stock fund during that particular period would have lost over 40% in less than a month.  “Yippee Ki Ay, Mother, um, Fellow Trader.”

So if you choose to go that route, best of luck, but please make your answer to Question #2 above a very small number (Hint: 10% or less, at least in one man’s opinion).

One Other Possibility 

One other possibility (and as always and for the record, this is NOT a recommendation, just an illustration of one way to play), is to buy a deep-in-the-money put option on ticker GDX.  GDX is the Market Vectors Gold Miners ETF.  The purpose of buying a deep-in-the-money put option is to enter a position that will closely track an actual short position in gold stock shares (also not my own personal cup of tea) with limited risk.  Consider:

GDX November 2013 (Week 1) 28.5 put @ $3.80

20131001-01

Figure 1 – In-the-money put option on GDX (Source: www.OptionsAnalysis.com)

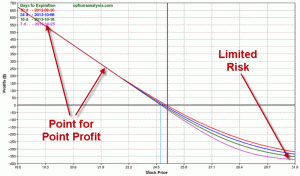
As you can see in the risk curves in Figure 2, this position enjoys limited risk if gold stocks decide to rally instead of decline.  In addition, with GDX trading at $25.02 a share, the breakeven price for this position is $24.70 (as of October Trading Day 19, or October 25th).  Below that price the put option will gain dollar for dollar with an actual short position in ticker GDX.

20131001-02

Figure 2 – Limited risk and point for point (vis a vis a short position in GDX shares) profit if GDX declines (Source: www.OptionsAnalysis.com)

Summary

 So is this “Jay’s Hot Pick” for October?  Sorry folks, the Marketing Hype Office is closed today.  This is simply an illustration of “one way to play” the short side of “something” when the odds suggest a decline is a possibility.  Also please remember that as I mentioned last time, gold stocks are one of the most beaten down sectors around, so an exception to the “gold stocks are bearish during October” meme should surprise no one. Therefore, if you do decide to play the short side of gold stocks during October, just remember not to “bet the ranch”.

That’s all I have to say about that.  On second thought, and in all candor,  if gold stocks do happen to plummet in the weeks ahead, I will probably mention this trade again.

Sorry, it’s just my nature.

Jay Kaeppel