A lot of U.S investors have come to realize in recent years that there are many trading opportunities outside the USA. This creates something of a bad news, good news, bad news, good news situation.
-The bad news is that picking individual stocks is never an easy thing even if you focus only on domestic U.S. companies. For the average investor to successfully pick and choose among individual stocks around the globe is simply too much to expect.
-The good news is that the proliferation of international ETFs – Single country funds, regional funds, global funds, etc. – has made it much easier for investors to diversify across the globe than it used to be.
-The bad news is that the proliferation of ETFs has also reached a point where choosing an international ETF is getting to be almost as confusing as choosing a phone plan.
-The good news is that there are ways to simplify and systematize things.
So let’s take a look at “one way” to play the international stocks game.
BRIC vs. SPX
BRIC refers to an index comprised of stocks from Brazil, Russia, India and China. For the purposes of this article I will demonstrate a simple method for switching between BRIC and the S&P 500 Index.
The Vehicles:
For calculating switches I will use:
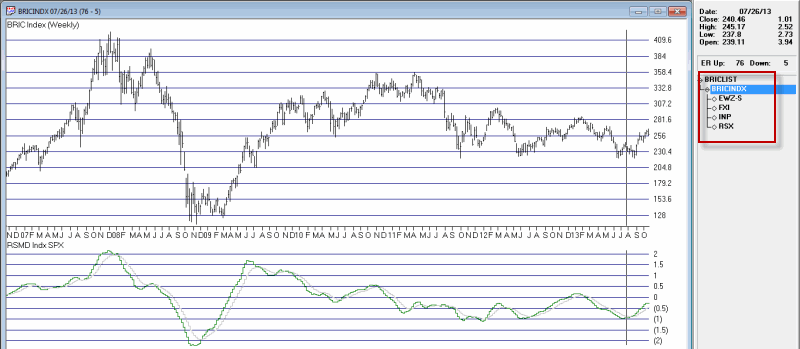
1) An index I created using AIQ TradingExpert. I refer to it as BRICINDX and it is comprised of single-country ETF tickers EWZ (Brazil), RSX (Russia), INP (India) and FXI (China).  Figure 1 – Jay’s BRICINDEX
2) Ticker SPX (i.e., the S&P 50 Index)
For actual trading purposes there are a few choices that I will discuss a little later.
The Method:
I will use a method I learned a long time ago from David Vomund, President of Vomund Investment Management, LLC and the author of “ETF Strategies Revealed.” The measure calculates the relative strength between two assets on a weekly basis. When the trend of relative strength reverses in a particular direction for two consecutive weeks it signals a switch into the stronger index.
The Test:
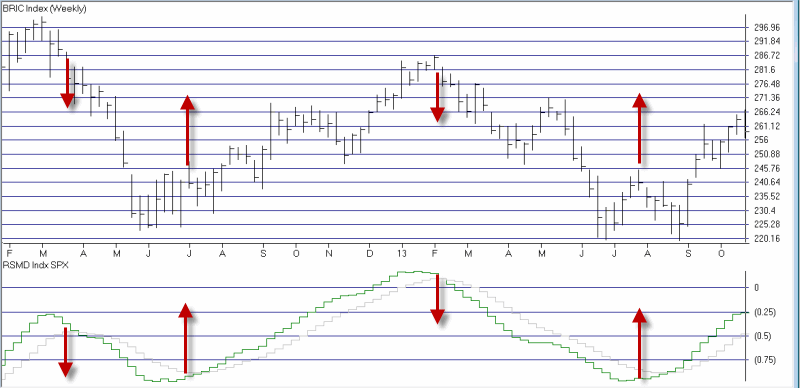
We start our test on 10/26/01 simple because that is the first time we can get a good reading using back data. Each week we look at the relative strength of my BRICINDX versus the S&P 500 Index (ticker SPX). If the RSMD rises for two consecutive weeks we want to switch into the BRICINDX and if the RSMD declines for two consecutive weeks we want to switch into the S&P 500 Index. Figure 2 displays the switches over the past several years.
Figure 2 – BRICINDEX (vs. SPX; lower clip)
When an “Up” arrow occurs in Figure 2, the system switches into BRICINDX, hen a “Down” arrow occurs in Figure 2 the system switches into ticker SPY. The results of this “System” are displayed in Figure 3. Note the two columns at the far right:
Switch: The growth of $1,000 using the system
Split: The growth of $1,000 split evenly between BRICINDX and SPY.
| BRIC | SPY | Switch | Split | Switch | Split | |||
| Date | Date | Index | %+(-) | %+(-) | %+(-) | %+(-) | $1,000 | $1,000 |
| 10/26/01 | 2/8/02 | BRIC | 20.9 | 3.7 | 20.9 | 12.3 | 1,209 | 1,123 |
| 2/8/02 | 2/22/02 | SPY | 13.9 | 0.0 | 0.0 | 7.0 | 1,209 | 1,201 |
| 2/22/02 | 5/10/02 | BRIC | (12.6) | (3.2) | (12.6) | (7.9) | 1,057 | 1,106 |
| 5/10/02 | 7/19/02 | SPY | (25.0) | (23.8) | (23.8) | (24.4) | 806 | 837 |
| 7/19/02 | 8/2/02 | BRIC | (14.1) | 1.9 | (14.1) | (6.1) | 692 | 786 |
| 8/2/02 | 11/1/02 | SPY | (0.8) | 8.8 | 8.8 | 4.0 | 753 | 817 |
| 11/1/02 | 6/27/03 | BRIC | 45.0 | 7.1 | 45.0 | 26.0 | 1,091 | 1,030 |
| 6/27/03 | 8/29/03 | SPY | 18.3 | 5.3 | 5.3 | 11.8 | 1,000 | 1,000 |
| 8/29/03 | 11/14/03 | BRIC | 10.9 | 2.1 | 10.9 | 6.5 | 1,109 | 1,065 |
| 11/14/03 | 12/12/03 | SPY | 11.9 | 2.5 | 2.5 | 7.2 | 1,137 | 1,142 |
| 12/12/03 | 1/23/04 | BRIC | 16.4 | 7.7 | 16.4 | 12.1 | 1,324 | 1,280 |
| 1/23/04 | 7/2/04 | SPY | (18.5) | (3.4) | (3.4) | (10.9) | 1,279 | 1,140 |
| 7/2/04 | 11/5/04 | BRIC | 29.0 | 4.7 | 29.0 | 16.8 | 1,650 | 1,331 |
| 11/5/04 | 12/3/04 | SPY | 9.0 | 1.8 | 1.8 | 5.4 | 1,679 | 1,403 |
| 12/3/04 | 12/31/04 | BRIC | (0.2) | 0.9 | (0.2) | 0.3 | 1,675 | 1,408 |
| 12/31/04 | 2/11/05 | SPY | 5.4 | 0.3 | 0.3 | 2.9 | 1,681 | 1,449 |
| 2/11/05 | 3/25/05 | BRIC | (4.3) | (2.8) | (4.3) | (3.5) | 1,609 | 1,398 |
| 3/25/05 | 7/1/05 | SPY | 8.1 | 2.7 | 2.7 | 5.4 | 1,653 | 1,473 |
| 7/1/05 | 10/21/05 | BRIC | 13.9 | (0.4) | 13.9 | 6.7 | 1,882 | 1,572 |
| 10/21/05 | 1/13/06 | SPY | 18.3 | 7.6 | 7.6 | 12.9 | 2,024 | 1,776 |
| 1/13/06 | 3/17/06 | BRIC | 9.6 | 1.6 | 9.6 | 5.6 | 2,219 | 1,876 |
| 3/17/06 | 4/28/06 | SPY | 9.0 | (0.0) | (0.0) | 4.5 | 2,219 | 1,961 |
| 4/28/06 | 5/26/06 | BRIC | (13.5) | (3.3) | (13.5) | (8.4) | 1,920 | 1,796 |
| 5/26/06 | 8/4/06 | SPY | 9.2 | 1.5 | 1.5 | 5.4 | 1,948 | 1,892 |
| 8/4/06 | 9/1/06 | BRIC | 2.1 | 2.9 | 2.1 | 2.5 | 1,988 | 1,939 |
| 9/1/06 | 10/20/06 | SPY | 4.2 | 4.4 | 4.4 | 4.3 | 2,076 | 2,023 |
| 10/20/06 | 2/16/07 | BRIC | 23.4 | 6.2 | 23.4 | 14.8 | 2,561 | 2,322 |
| 2/16/07 | 4/13/07 | SPY | 5.2 | 0.5 | 0.5 | 2.8 | 2,573 | 2,387 |
| 4/13/07 | 8/17/07 | BRIC | 5.0 | (1.4) | 5.0 | 1.8 | 2,700 | 2,430 |
| 8/17/07 | 9/7/07 | SPY | 11.2 | 0.8 | 0.8 | 6.0 | 2,722 | 2,576 |
| 9/7/07 | 12/21/07 | BRIC | 35.8 | 2.4 | 35.8 | 19.1 | 3,696 | 3,067 |
| 12/21/07 | 4/25/08 | SPY | (9.3) | (6.4) | (6.4) | (7.9) | 3,458 | 2,826 |
| 4/25/08 | 6/13/08 | BRIC | (3.0) | (2.4) | (3.0) | (2.7) | 3,353 | 2,749 |
| 6/13/08 | 12/5/08 | SPY | (57.0) | (35.5) | (35.5) | (46.2) | 2,164 | 1,478 |
| 12/5/08 | 6/26/09 | BRIC | 53.1 | 5.4 | 53.1 | 29.3 | 3,314 | 1,911 |
| 6/26/09 | 10/2/09 | SPY | 20.4 | 12.2 | 12.2 | 16.3 | 3,719 | 2,223 |
| 10/2/09 | 11/6/09 | BRIC | 9.6 | 5.3 | 9.6 | 7.5 | 4,076 | 2,388 |
| 11/6/09 | 4/9/10 | SPY | 5.6 | 9.3 | 9.3 | 7.5 | 4,454 | 2,567 |
| 4/9/10 | 4/23/10 | BRIC | (2.0) | 1.3 | (2.0) | (0.3) | 4,365 | 2,558 |
| 4/23/10 | 6/18/10 | SPY | (6.2) | (8.2) | (8.2) | (7.2) | 4,008 | 2,374 |
| 6/18/10 | 11/19/10 | BRIC | 11.7 | 7.9 | 11.7 | 9.8 | 4,475 | 2,606 |
| 11/19/10 | 3/11/11 | SPY | (0.1) | 8.2 | 8.2 | 4.0 | 4,843 | 2,712 |
| 3/11/11 | 5/6/11 | BRIC | (0.4) | 3.6 | (0.4) | 1.6 | 4,823 | 2,755 |
| 5/6/11 | 6/10/11 | SPY | (1.9) | (5.2) | (5.2) | (3.6) | 4,571 | 2,656 |
| 6/10/11 | 7/15/11 | BRIC | (1.7) | 2.3 | (1.7) | 0.3 | 4,494 | 2,664 |
| 7/15/11 | 11/4/11 | SPY | (11.7) | (3.3) | (3.3) | (7.5) | 4,344 | 2,463 |
| 11/4/11 | 12/16/11 | BRIC | (15.3) | (4.7) | (15.3) | (10.0) | 3,678 | 2,216 |
| 12/16/11 | 1/20/12 | SPY | 16.0 | 9.4 | 9.4 | 12.7 | 4,024 | 2,497 |
| 1/20/12 | 3/23/12 | BRIC | 2.4 | 7.6 | 2.4 | 5.0 | 4,121 | 2,623 |
| 3/23/12 | 7/6/12 | SPY | (15.3) | (4.4) | (4.4) | (9.9) | 3,938 | 2,363 |
| 7/6/12 | 2/1/13 | BRIC | 17.5 | 10.5 | 17.5 | 14.0 | 4,628 | 2,694 |
| 2/1/13 | 7/26/13 | SPY | (15.2) | 12.7 | 12.7 | (1.3) | 5,216 | 2,660 |
| 7/26/13 | BRIC | 13.1 | 4.4 | 13.1 | 8.8 | 5,900 | 2,893 |
Figure 3 – BRICINDX vs. SPY
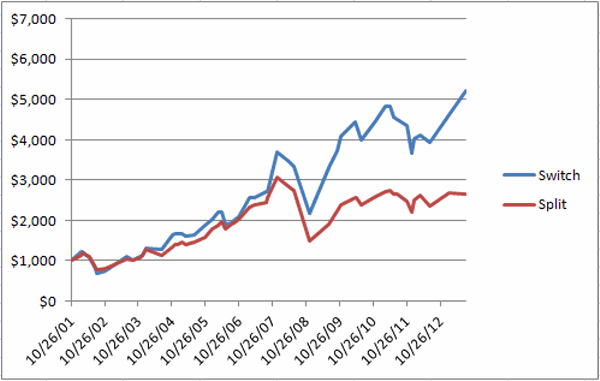
Figure 4 displays the trade-by-trade result in graphical form.  Figure 4 – Jay’s BRIC/SPY System (blue line) versus Split/Buy-and-Hold
A Few Performance Notes
-An investor who had split $1,000 between BRICINDX and SPY in 2001 would now have $2,893, a gain of 189.3%
-An investor who had utilized this switching system starting with $1000 in 2001 would now have $5,900, a gain of 490%. So you clearly see the potential long-term benefit.
-Long-term is the key phrase. While the system clearly outperformed over time, over any trade or series of trades there is no guarantee that that will be the case.
-One other thing to note is that this particular system is allows long the stock market, either foreign or domestic. This means that if there is a global bear market (such as 2008) this system will get suffer. Therefore, aggressive investors might consider building in some sort of market timing in order to avoid some of the downside.
A Few Trading Notes
For actual trading purposes a trader can emulate my BRICINDEX by splitting money between the four ETFs that comprise the index. There are other, easier alternatives including:
-Ticker VWO: Vanguard Emerging Markets ETF does not track these four funds exactly but has a correlation of roughly 97% with the BRICINDX and enjoys active trading volume.
-Ticker BKF: iShares BRIC Index Fund is the fund most closely correlated to my BRICINDX, however, trading is very thin.
-Ticker DXELX: This is the Direxion 2x leveraged Emerging Markets open end mutual fund. The leverage creates more profit potential (with commensurate downside risk) and this is a good choice for someone who would rather trade a standard mutual fund than an ETF.
-Ticker EDC: I am leery of 3x leveraged ETFs, but someone looking to “go for the gusto”, -Direxion Emerging Markets 3x ETF offers a lot of upside potential (but also a great deal of downside risk)
Summary
The “system” I’ve detailed here isn’t necessarily something that you should rush out and start trading right this very minute. Still, it does illustrate a few things:
-It is possible to “beat the market” (in this case, the “market” is defined as a portfolio evenly split between foreign and domestic stock indexes) over time using a mechanical approach.
-It is possible to profit from global stock market trends without becoming an expert in Chinese stocks or Russian stocks (or whatever country’s stocks).
-Demonstrating the discipline to follow an objective approach to investing is one of the keys to long-term success.
All in all it’s just another, well, you can sing the rest of it yourself……
Jay Kaeppel


Thank you for the article and… Pink Floyd forever! 🙂
With best wishes from Russia.
I really like the idea of switching, but why keep it to only equities? I would be interested to see how the performance would differ if you switched between SPX and a commodity ETF.