Well now that we know that the U.S. government will remain solvent (assuming that your definition of “solvent” involves at least 17 trillion dollars of debt) is it time to take another look at T-bonds? Well I can’t comment so much on the fundamentals but I can read a calendar. And we are closing in on one of the “sweet spots” on the seasonal calendar for bonds.
How’s that? T-bonds have displayed a tendency to advance between the close of trading on the 17th trading day of October through the fourth trading day in December. Since 1979 t-bonds have gained ground 82% of the time during this time period. Does this mean that we can absolutely, positively expect t-bonds to rise in price between late October and early December? Not necessarily. But for a speculator willing to risk a few dollars on a trend with a good track record it may be something to consider. Let’s take a closer look.
A Strong Seasonal Period for T-Bonds
As I mentioned, the favorable seasonal period we will be looking at extends from the close of trading on the 17th trading day of October and extends through the close of the 4th trading day of December. So for this year, the period extends from:
-The close on 10/23/2013
Through the close on 12/5/2013
-The history of this trend appears in Figure 1
Column 1 displays the year
Column 2 displays the raw dollars gained by buying and holding one t-bond futures contract (a 1 point movement in t-bond futures prices equals $1,000)
Column 3 displays the % change in the price for t-bonds
|
Year |
T-Bond $ |
T-Bond % |
|
1979 |
$3,250 |
5.3% |
|
1980 |
($5,031) |
-9.5% |
|
1981 |
$9,313 |
24.1% |
|
1982 |
$3,000 |
5.3% |
|
1983 |
$313 |
0.6% |
|
1984 |
$1,094 |
2.0% |
|
1985 |
$5,031 |
8.3% |
|
1986 |
$6,156 |
7.8% |
|
1987 |
$1,688 |
2.4% |
|
1988 |
$531 |
0.7% |
|
1989 |
($313) |
-0.4% |
|
1990 |
$4,531 |
6.2% |
|
1991 |
$3,844 |
4.8% |
|
1992 |
$2,688 |
3.1% |
|
1993 |
($250) |
-0.2% |
|
1994 |
$3,219 |
4.0% |
|
1995 |
$3,469 |
3.5% |
|
1996 |
$4,031 |
4.3% |
|
1997 |
$2,406 |
2.4% |
|
1998 |
$1,406 |
1.3% |
|
1999 |
$1,625 |
1.7% |
|
2000 |
$3,125 |
3.1% |
|
2001 |
($3,281) |
-3.0% |
|
2002 |
$3,688 |
3.4% |
|
2003 |
$2,031 |
1.9% |
|
2004 |
($1,656) |
-1.4% |
|
2005 |
$94 |
0.1% |
|
2006 |
$4,406 |
4.0% |
|
2007 |
$3,282 |
2.9% |
|
2008 |
$14,150 |
11.8% |
|
2009 |
$188 |
0.1% |
|
2010 |
($5,727) |
-4.0% |
|
2011 |
$906 |
0.6% |
|
2012 |
$4,095 |
2.5% |
|
Average |
$2,274 |
2.9% |
|
Median |
$2,547 |
2.5% |
Figure 1 – Annual Results of Seasonally Favorable Period
Relevant Figures:
# Times UP: 28 (82.4%)
# Times DOWN: 6 (17.6%)
Average $ Gain: $3,341
Average % Loss: (-$2,710)
Average % Gain: +4.2%
Average % Loss: (-3.1%)
Average Median Result of all trades: +$2,547
The key numbers to note are 82.4% winning trades and a median gain of +$2,547.
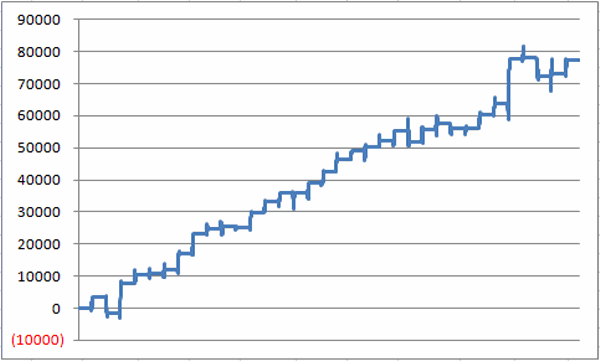
Figure 2 displays the equity growth from holding a long position in t-bond futures every year during this seasonally favorable period starting in October 1979. 
Figure 2 – Equity growth: Long 1 t-bond futures contract from October TD 17 through December TD 4 (1979-2012)
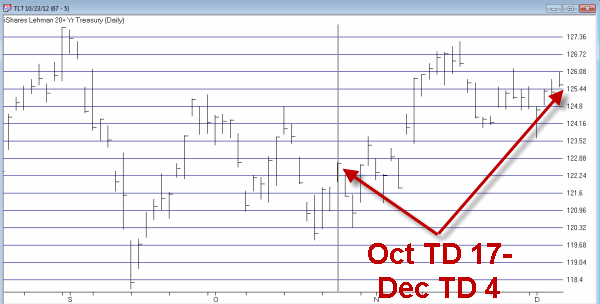
Figure 3 displays the action of ticker TLT – the exchange-traded fund that tracks the long-term t-bond during the relevant period during 2012.
Figure 3 – Ticker TLT in 2012 (Courtesy: AIQ TradingExpert)
Summary
To things to note:
-Nothing presented here is intended to imply that bonds are sure to rally during the favorable period this time around.
-For the “average” trader, the best way to play this trend may be a deep-in-the-money call option on ticker TLT.
We will take another look at this as October 23rd draws closer.
Jay Kaeppel
NEW! Video Course: How to Find Longer-Term Bull Call Spreads

