Alright, so the pundits – myself included – have issued all of the usual warnings about the fact that September has historically been the worst month of the year for the stock market. So at this point, a lot of investors may be feeling some trepidation (my big word for the day, hope you enjoyed it) t this point.
For the moment I offer three “rays of hope”.
1) Most of the September “damage” in the stock market has a tendency to occur after the 11th trading day of the month. For 2013, that means after the close on 9/17. http://tinyurl.com/mtez9cw
2) According to research from Wayne Whaley of Witter & Lister, Inc., when the S&P 500 is up during July and down during August, September has showed a gain 11 of 15 times, including the last 8 in a row. http://tinyurl.com/pyh838a
3) A simple two fund portfolio may improve your odds of success during the month of September
Simple Two Fund September Portfolio
For reasons that I will make no attempt to explain (mostly because I am not sure that I can), certain sectors have showed a tendency to perform better during certain months. The month of September – despite it’s well earned nasty reputation – is no exception. Let’s consider a two fund portfolio split evenly between health-care related stocks and gold stocks.
For testing purposes we will use Fidelity Select Medical Delivery (ticker FSHCX) and Fidelity Select Gold (ticker FSAGX). That being said, there are many alternatives for those who would prefer to use an ETF or another fund family, as displayed in Figure 1.
Figure 1 – Alternative funds
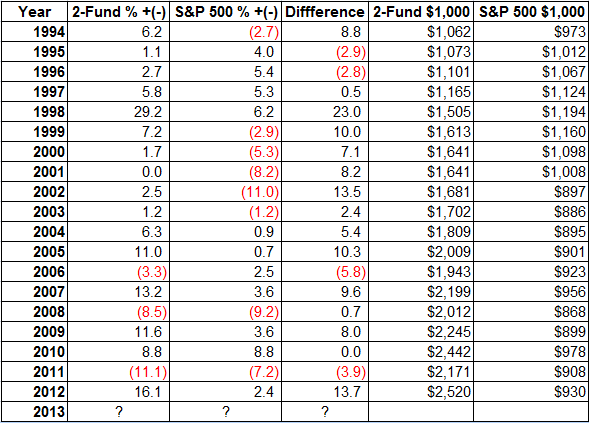
As with all things in the exciting world of investing – and particularly so when considering seasonal trends – there is never any guarantee that even the best method will generate a profit the next time around. So things are generally best considered on a long-term basis. That caveat out of the way, the performance for this two fund portfolio versus the S&P 500 only during the month of September appears in Figure 2.
Figure 2 – Annual results, 2-fund September portfolio versus the S&P 500 Index
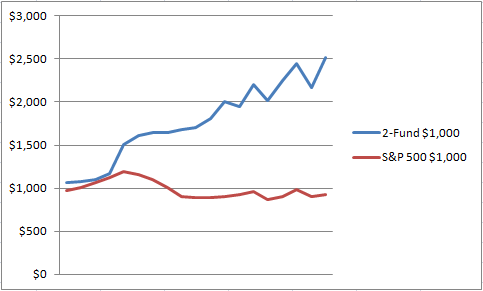
Figure 3 displays the growth of $1,000 generated during September by the two fund portfolio versus the S&P 500 Index.
Figure 3 – Growth of $1,000 invested in the 2-Fund September portfolio (blue line) versus $1,000 invested each September in the S&P 500 Index (red line).
A few facts and figures of note, starting in 1994:
Figure 4 – Comparative Results: 2-Fund Portfolio versus S&P 500
Summary
So is it time to “Sell everything” and “bet the ranch on medical and gold stocks”? Um, probably not. As I mentioned earlier, despite historical results there is no guarantee that the 2-Fund Portfolio will show a gain for the month of September, let alone outperform the S&P 500. Still, one of our primary jobs as investors is to look for an “edge” in the markets whenever and wherever we can, and consider the relative pros and cons. The stock market in the month of September has a pretty checkered past. The simple 2-Fund portfolio I’ve discussed here has displayed a decided long-term edge on the overall market.
We’ll see what happens this time around.


