The Dow “number to beat” at the moment is 27,046.23. Why? Because that’s where it closed October of 2019 (you remember, back in the “Good Old Days”). If the Dow closes the month of April below 27,046.23 it presents a negative signal for the next six months, generally speaking.
The Track Record
So, for the purposes of this test we will break the year into two 6-month periods:
*November through April (the “Power Zone”) and May through October (“the Dead Zone”)
Then we will:
*look at how the Dow performs during the “6-month Dead Zone” in those years where the Dow finishes the “6-month Power Zone” with a loss
In other words, how does the Dow perform May through October after November through April registers a loss?
First the Good News
The Good News is that 44% of the time a loss during the 6-month Power Zone was followed by a gain during the subsequent 6-monht Dead Zone. So, it is not like a November through April decline is a sure-fire sign of impending trouble.
Still, it is a warning sign as we will see next.
Now the Bad News
When the 6-month Power Zone showed a loss, the Dow during the subsequent 6-month Dead Zone:
*Lost ground 56% of the time
*The average loss for all periods was -3%
*The average gain during up periods was +11.1%
*The average loss during down periods -14.3%
In a nutshell, the percentage of winning trades was less than 50%, and the average loser was bigger than the average winner.
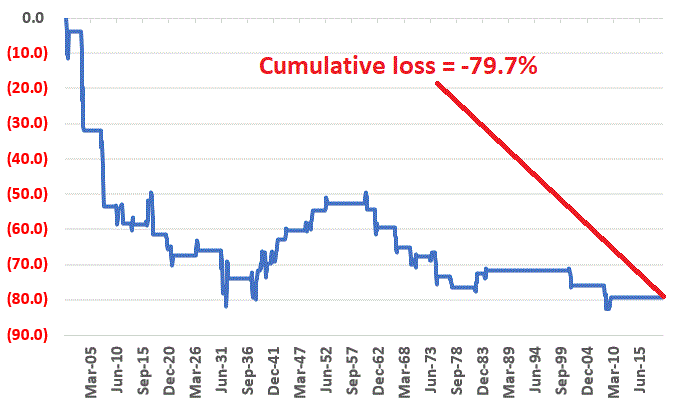
Figure 1 displays the cumulative price return for the Dow if held only during May through October after November through April showed a loss, starting in 1900.

Figure 1 – Cumulative Dow % +(-) during 6-month Dead Zone after 6-month Power Zone shows a loss (1900-2019)
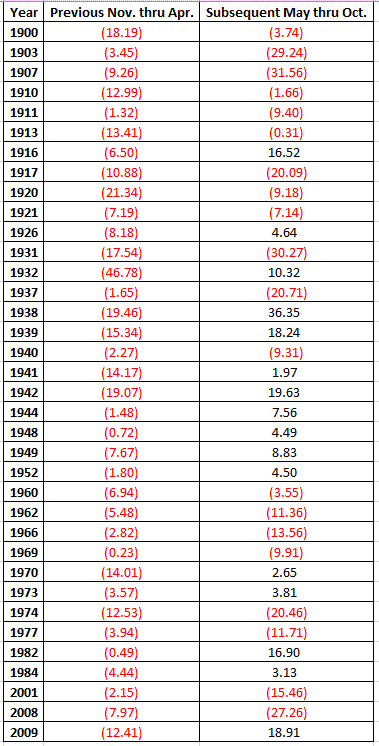
In sum, the Dow lost -79.2% during these periods. It is interesting to note that from 1941 through 1952 there were six consecutive times when a down Nov. through Apr. was followed by an up May through Oct. (see Figure 3).
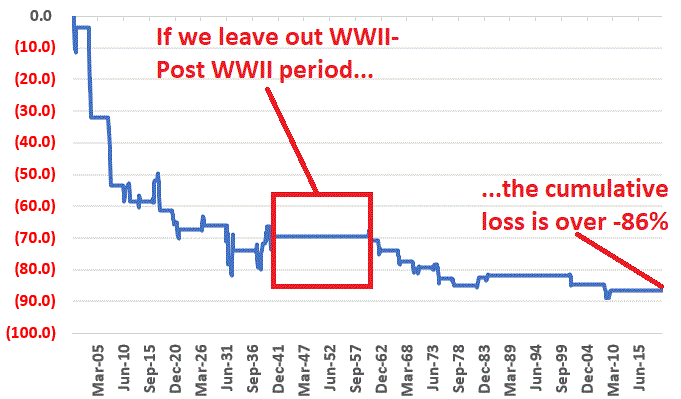
If we take out this WWII-post WWII period the cumulative loss was -90.2% as shown in Figure 2 and the percentage of winning trades drops from 44% to 33%.

Figure 2 – Cumulative Dow % +(-) during 6-month Dead Zone after 6-month Power Zone shows a loss – excluding WWII-Post WWII years of 1941-1952 (1900-2019)
Figure 3 displays the year-by-year results, i.e., column 2 shows the Nov. through Apr. decline and column 3 displays the Dow % + (-) over the next six months.

Figure 3 – Year-by-year results
Summary
If the Dow ends April 2020 with a 6-month loss does that mean that the market is “doomed” to decline in the following 6 months. Obviously not, as historically gains have followed 44% of the time.
However, it also would be another sign that caution would be in order.
Jay Kaeppel
Disclaimer: The information, opinions and ideas expressed herein are for informational and educational purposes only and are based on research conducted and presented solely by the author. The information presented does not represent the views of the author only and does not constitute a complete description of any investment service. In addition, nothing presented herein should be construed as investment advice, as an advertisement or offering of investment advisory services, or as an offer to sell or a solicitation to buy any security. The data presented herein were obtained from various third-party sources. While the data is believed to be reliable, no representation is made as to, and no responsibility, warranty or liability is accepted for the accuracy or completeness of such information. International investments are subject to additional risks such as currency fluctuations, political instability and the potential for illiquid markets. Past performance is no guarantee of future results. There is risk of loss in all trading. Back tested performance does not represent actual performance and should not be interpreted as an indication of such performance. Also, back tested performance results have certain inherent limitations and differs from actual performance because it is achieved with the benefit of hindsight.

