The standard mantra for investing historically has been “buy low, sell high.” Yet many who have been in the markets for some time come to learn the value of the far less intuitive – but much easier to actually implement – “buy high, sell higher.”
Essentially this approach involves waiting for “a show of strength” and then piling in. At first blush, it sounds like a risky idea. Maybe that’s why investing is so vexing to so many – because the intuitive take is wrong.
Four is Fine
The Dow, the S&P 500 Index and the Russell 2000 Index all registered their fourth consecutive higher monthly close on 12/31/2019. Does this matter?
To answer that question let’s consider the following strategy – we will call it the Up 4 Strategy – using 1/3/1971 as a start date:
*If either the Dow Jones Industrial Average OR the S&P 500 Index OR the Russell 2000 Index registers four consecutive higher monthly closes, we will buy and hold the S&P 500 Index for the next 12 months
*If a subsequent signal occurs (i.e., if the index registers subsequent higher months or if another index subsequently registers four straight up months) we start the 12 months count again (see further explanation below)
*If no index has register four consecutive up months in the previous 12 months then we will hold 3-7 year intermediate-term treasuries
Further explanation of Buy Rule: Let’s say the Dow registers four straight up months at the end of December 2020. We would now buy and hold the S&P 500 Index at least through the end of December 2021. If the Dow is up again in January 2021, we would extend the holding period to the end of January 12 months later (i.e., January 2022). Now let’s say that the Russell 2000 registers four straight up months at the end of June 2021. We would then extend the holding period another 12 months to June of 2022. If none of the 3 indexes registers four straight up months through the end of June 2022 then we would sell the S&P 500 Index at the end of June 2022 and hold intermediate-term treasuries until a new buy signal.
OK, not sure if that helped or complicated things, but there you have it.
Results
So, our strategy is to hold the S&P 500 Index for 12 months after each “Up 4” signal and to hold intermediate-term treasuries if no new signal has occurred in that past 12 months.
Figure 1 displays the growth of $1,000 invested using our “Up 4 Strategy” versus buying and holding the S&P 500 Index from Feb 1971 through Dec 2019.

Figure 1 – Cumulative growth of $1,000 using Up 4 Strategy (blue) versus buying-and-holding S&P 500 Index (orange)
For the record:
*$1,000 invested using the System grew to $280,377
*$1,000 invested buying-and-holding the S&P 500 grew to $102,542
Looking at 12-month returns
Figure 2 displays the 12-month % return for the S&P 500 Index after every “Up 4” buy signal (including overlaps).

Figure 2 – S&P 500 12-month % +(-) following ALL Up 4 buy signals
*The “average” 12-month S&P 500 total return following all Up 4 buy signals was +14.8%
*47 of 48 of “all” signals witnessed a gain for the S&P 500 Index 12 months later
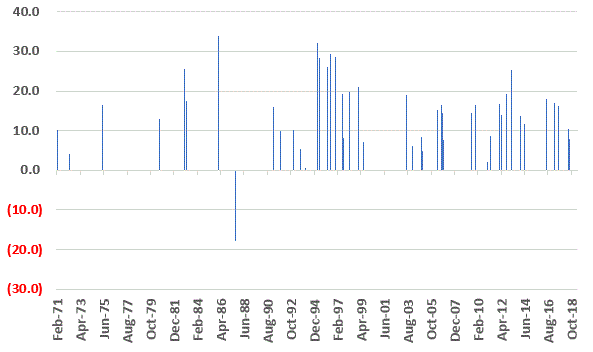
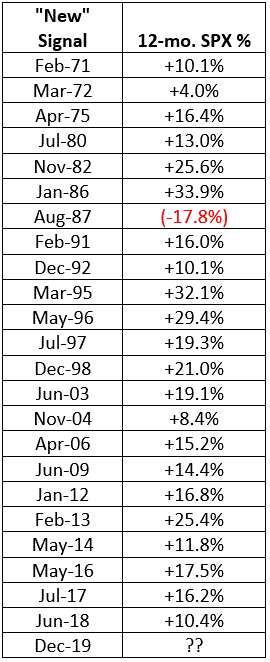
Figure 3 takes out all the overlaps and shows the return for the S&P 500 in the 12-months following each Up 4 signal that was the first signal in the prior 12 months.

Figure 3 – S&P 500 12-month % +(-) following all NEW Up 4 buy signals (i.e., 1st signal in previous 12 months)
*The “average” 12-month S&P 500 total return following each “New” Up 4 buy signal was +16.0%
*22 of 23 “new” signals witnessed a gain for the S&P 500 Index 12 months later
A Word on Risk
From all appearances buying after a Up 4 buy signal looks like a pretty good bet. But just to cover all the bases, I should remind you that (the current bull market notwithstanding) “nothing is ever easy.” Figure 4 displays the drawdowns for the Up 4 Strategy. The biggest drop came in 1987 when the market crashed in the month of October. Overall, there were 3 different drawdowns in excess of -15% and 2018 witnessed a drawdown of -13.5% as the market broke hard in October and December.

Figure 4 – Up 4 Strategy Maximum Drawdowns
Summary
For the record, the Up 4 Strategy has been bullish non-stop since the end of April 2016. Another new buy signal occurred at the end of 2019 as all 3 indexes registered their fourth consecutive “Up” close.
Does this guarantee another up year for the stock market in 2020? As 1987 proved, nothing is ever guaranteed in the financial markets. But the historical results of this particular trend suggest we should continue to give the bullish case the benefit of the doubt.
Jay Kaeppel
Disclaimer: The information, opinions and ideas expressed herein are for informational and educational purposes only and are based on research conducted and presented solely by the author. The information presented does not represent the views of the author only and does not constitute a complete description of any investment service. In addition, nothing presented herein should be construed as investment advice, as an advertisement or offering of investment advisory services, or as an offer to sell or a solicitation to buy any security. The data presented herein were obtained from various third-party sources. While the data is believed to be reliable, no representation is made as to, and no responsibility, warranty or liability is accepted for the accuracy or completeness of such information. International investments are subject to additional risks such as currency fluctuations, political instability and the potential for illiquid markets. Past performance is no guarantee of future results. There is risk of loss in all trading. Back tested performance does not represent actual performance and should not be interpreted as an indication of such performance. Also, back tested performance results have certain inherent limitations and differs from actual performance because it is achieved with the benefit of hindsight.


It would be nice if you could give the dates of the sell signals considering how hard it is to figure out what they are.
How much of the upside with the 4Up can be attributed to holding the treasuries? What would the equity curve look like if cash was used instead?