In this article I wrote about a group of Fidelity sector funds that – as a group – tends to perform well between Nov 1 and Apr 30th.
In this article I wrote about two funds that tend to perform well between May 1 and Aug 31st.
So, what happens if we put the two together?
Jay’s Seasonal Combined Portfolio
From Nov 1 through Apr 30 the portfolio holds:
*Chemicals
*Electronics
*Health Care Services
*Construction and Housing
*Retailing
From May 1 through Aug 31 the portfolio holds:
*Health Care
*Long-Term Treasury Bonds
From Sep 1 through Oct 31 the portfolio holds:
*Intermediate-Term Treasuries
Figure 1 displays the funds that were held each month during testing. FYI, for September and October we simply hold intermediate-term treasuries.

Figure 1 – Jay’s Seasonal Combined Portfolio (Fidelity version)
*For the record, an actual investor at Fidelity would likely use FNGBX (Fidelity Long-Term Treasury) rather than VUSTX (Vanguard Long-Term Treasury). But VUSTX has a longer track record so I used it in the original test.
Figure 2 displays an “ETF Version” of the Seasonal Combined Portfolio

Figure 2 – Jay’s Seasonal Combined Portfolio (ETF version)
Results
The test period extends from 10/31/1986 through 10/31/2019, or 33 years.
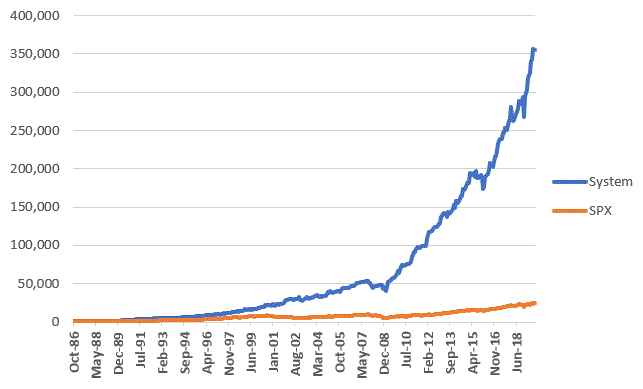
Figure 3 displays the growth of $1,000 invested using Jay’s Seasonal Combined Portfolio versus buying and holding the S&P 500 Index.

Figure 3 – Growth of $1,000 invested in Seasonal Combined Portfolio (blue) versions S&P 500 Index buy-and-hold (orange); 10/31/86-10/31/19
For the record, $1,000 using the strategy grew to $354,641 versus $24,972 for the S&P 500 Index.
Figure 4 displays some relevant facts and figures.
| Measure | System | SPX |
| Average 12 mos. %+(-) | +20.0% | +11.0% |
| Median 12 mos. % +(-) | +19.7% | +13.2% |
| Std Dev. % | 13.6% | 16.0% |
| Average/StdDev | 1.47 | 0.69 |
| Worst 12 mos. % | (-15.6%) | (-43.3%) |
| MaxDrawdown % | (-25.2%) | (-51.0%) |
| Average 5-Yr % +(-) | +145.8% | +70.7% |
| Worst 5-Tr. % +(-) | +15.3% | (-29.4%) |
Figure 4 – Results
Figure 5 displays the hypothetical year-by-year results.
| Year | System | SPX |
| 1987 | 33.3 | 4.7 |
| 1988 | 20.6 | 16.2 |
| 1989 | 34.9 | 31.4 |
| 1990 | 32.4 | (3.3) |
| 1991 | 57.8 | 30.2 |
| 1992 | 16.3 | 7.4 |
| 1993 | 10.9 | 9.9 |
| 1994 | 8.1 | 1.2 |
| 1995 | 31.9 | 37.4 |
| 1996 | 23.0 | 22.9 |
| 1997 | 17.7 | 33.2 |
| 1998 | 39.8 | 28.6 |
| 1999 | 15.3 | 21.1 |
| 2000 | 22.2 | (9.1) |
| 2001 | 24.9 | (12.0) |
| 2002 | 2.7 | (22.1) |
| 2003 | 13.6 | 28.5 |
| 2004 | 16.1 | 10.7 |
| 2005 | 9.8 | 4.8 |
| 2006 | 15.6 | 15.6 |
| 2007 | 3.2 | 5.4 |
| 2008 | (10.5) | (37.0) |
| 2009 | 46.5 | 26.5 |
| 2010 | 27.6 | 14.9 |
| 2011 | 16.3 | 2.0 |
| 2012 | 31.4 | 15.8 |
| 2013 | 17.4 | 32.2 |
| 2014 | 20.4 | 13.5 |
| 2015 | 3.2 | 1.2 |
| 2016 | 14.6 | 11.8 |
| 2017 | 21.9 | 21.7 |
| 2018 | 1.4 | (4.5) |
| 2019 | 32.3 | 23.0 |
Figure 5 – Hypothetical Yearly Results
Summary
So, is the Seasonal Combined Portfolio the “be all, end all” of investment strategies? Probably not. As always, I am not “recommending” that anyone rush off and start using this particular strategy because – as the saying goes – past performance is no guarantee of future results.
Strictly some (hopefully interesting) food for thought.
Jay Kaeppel
Disclaimer: The information, opinions and ideas expressed herein are for informational and educational purposes only and are based on research conducted and presented solely by the author. The information presented does not represent the views of the author only and does not constitute a complete description of any investment service. In addition, nothing presented herein should be construed as investment advice, as an advertisement or offering of investment advisory services, or as an offer to sell or a solicitation to buy any security. The data presented herein were obtained from various third-party sources. While the data is believed to be reliable, no representation is made as to, and no responsibility, warranty or liability is accepted for the accuracy or completeness of such information. International investments are subject to additional risks such as currency fluctuations, political instability and the potential for illiquid markets. Past performance is no guarantee of future results. There is risk of loss in all trading. Back tested performance does not represent actual performance and should not be interpreted as an indication of such performance. Also, back tested performance results have certain inherent limitations and differs from actual performance because it is achieved with the benefit of hindsight.

