In Part I here, I highlighted the fact that long-term treasuries have performed very well overall for over three+ decades. I also noted the fact that they are a pure play on interest rates and that if interest rates ever do rise again (the current consensus seems to be that that is never going to happen and that interest rates will inexorably move into negative territory), long-term treasuries would be expected to perform quite poorly.
In Part I, I also highlighted a 4-bond index portfolio (convertible bonds, high yield corporate bonds, long-term treasury and intermediate-term treasury) that:
*Gained almost as well as long-term treasuries
*Did so with a lot less volatility
*Has the potential to outperform long-term bonds if rates ever do rise again
So, all-in-all the 4-bond index seems like a “nice alternative” to holding long-term treasuries. But the title of these articles says “Beating the Bond Market” and not “Interesting Alternatives that do Just about as Well as Long-Term Treasuries” (which – let’s face it – would NOT be a very compelling title). So, let’s dig a little deeper. In order to dig a little deeper, we must first “go off on a little tangent.”
Bonds versus Stocks
In a nutshell, individual convertible bonds and high yield corporate bonds are tied to the fortunes of the companies that issue them. This also means that as an asset class, their performance is tied to the economy and the business environment in general. If times are tough for corporations it only makes sense that convertible bonds and high yield bonds will also have a tougher time of it. As such it is important to note that convertible bonds and high yield corporates have a much higher correlation to the stock market than they do to the long-term treasury.
In Figures 1 and 2 we use the following ETF tickers:
CWB – as a proxy for convertible bonds
HYG – As a proxy for high-yield corporates
TLT – As a proxy for long-term treasuries
IEI – As a proxy for short-term treasuries
SPX – As a proxy for the overall stock market
BND – As a proxy for the overall bond market
As you can see in Figure 1, convertible bonds (CWB) and high-yield corporates (HYG) have a much higher correlation to the stock market (SPX) than to the bond market (BND).
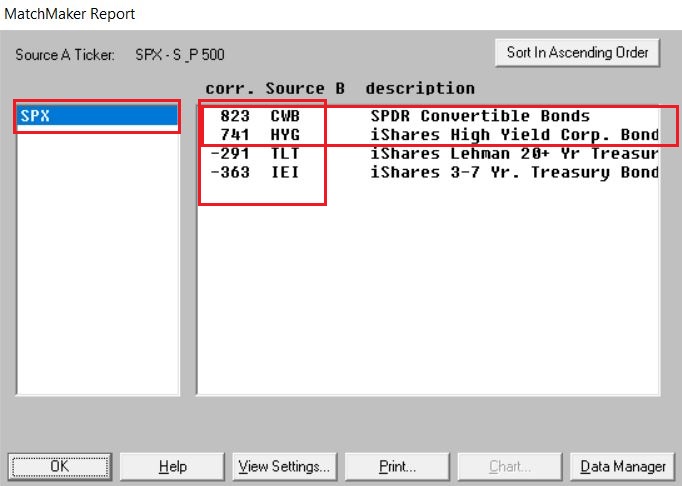
Figure 1 – 4-Bond Index Components correlation to the S&P 500 Index (Courtesy AIQ TradingExpert)
As you can see in Figure 2, long-term treasuries (TLT) and intermediate-term treasuries (IEI) have a much higher correlation to the bond market (BND) than to the stock market (SPX).
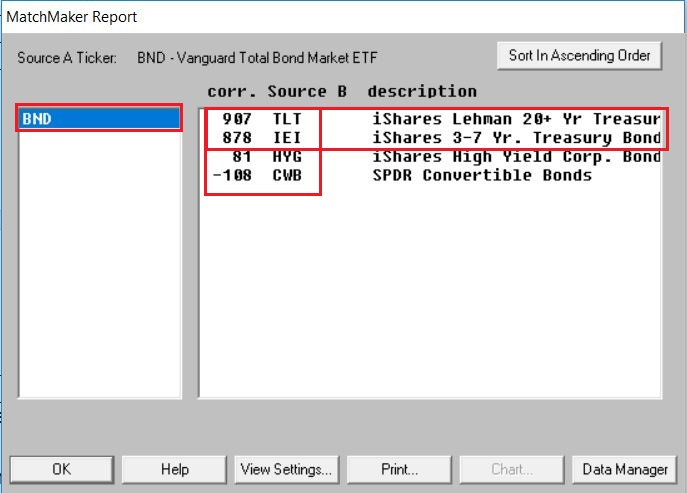
Figure 2 – 4-Bond Index Components correlation to Vanguard Total Bond Market ETF (Courtesy AIQ TradingExpert)
A Slight Detour
Figure 3 displays the cumulative price change for the S&P 500 Index during the months of November through April starting in 1949 (+8,881%)
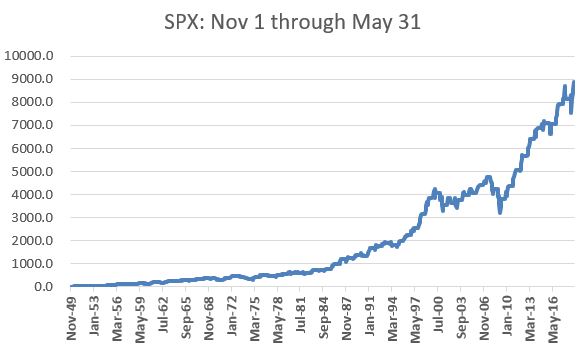
Figure 3 – Cumulative % price gain for S&P 500 Index during November through April (+8,881%); 1949-2019
Figure 4 displays the cumulative price change for the S&P 500 Index during the months of June through October starting in 1949 (+91%)
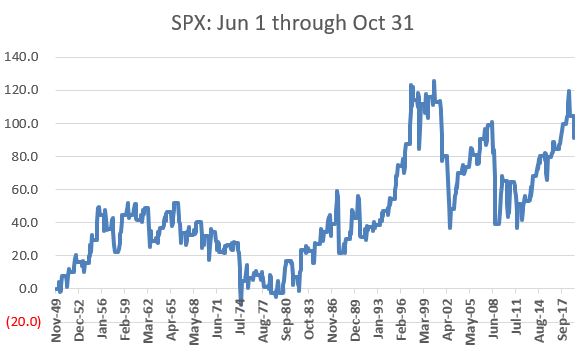
Figure 4 – Cumulative % price gain for S&P 500 Index during June through October (+91%); 1949-2019
The Theory: Parts 1 and 2
Part 1: The stock market performs better during November through April than during May through October
Part 2: Convertible bonds and high-grade corporate bonds are more highly correlated to stocks than long and intermediate-term treasuries
Therefore, we can hypothesize that over time convertible and high-yield bonds will perform better during November through April and that long and intermediate-term treasuries will perform better during May through October.
Jay’s Seasonal Bond System
During the months of November through April we will hold:
*Bloomberg Barclay’s Convertible Bond Index
*Bloomberg Barclays High Yield Very Liquid Index
During the months of May through October we will hold:
*Bloomberg Barclays Treasury Long Index
*Bloomberg Barclay’s Intermediate Index
(NOTE: While this article constitutes a “hypothetical test” and not a trading recommendation, just to cover the bases, an investor could emulate this strategy by holding tickers CWB and HYG (or ticker JNK) November through April and tickers TLT and IEI May through October.)
Figure 5 displays the growth of $1,000 invested using this Seasonal System (blue line) versus simply splitting money 25% into each index and then rebalancing on January 1st of each year (orange line).
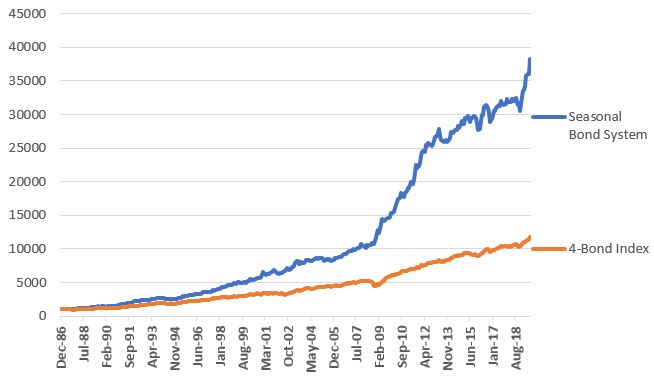
Figure 5 – Growth of $1,000 invested using Jay’s Seasonal System versus Buying-and-Holding and rebalancing (1986-2019)
Figure 6 displays some comparative performance figures.
| Measure | Seasonal System | 4 Indexes Buy/Hold/Rebalance |
| Average 12 month % +(-) | +11.9% | +8.0% |
| Std. Deviation % | 8.7% | 6.8% |
| Ave/StdDev | 1.37 | 1.18 |
| Max Drawdown% | (-9.2%) | (-14.8%) |
| $1,000 becomes | $38,289 | $11,774 |
Figure 6 – Seasonal Strategy versus Buy/Hold/Rebalance
From 12/31/1986 through 8/31/2019 the Seasonal System gained +3,729% versus +1,077% (3.46 times as much) as the buy/hold and rebalance method.
Summary
The Seasonal Bond System has certain unique risks. Most notably if the stock market tanks between November 1 and April 30, this system has no “standard” bond positions to potentially offset some of the stock market related decline that convertible and high yield bonds would likely experience. Likewise, if interest rates rise between April 30 and October 31st, this strategy is almost certain to lose value during that period as it holds only interest-rate sensitive treasuries during that time.
The caveats above aside, the fact remains that over the past 3+ decades this hypothetical portfolio gained almost 3.5 times that of a buy-and-hold approach.
Question: Is this any way to trade the bond market?
Answer: Well, it’s one way….
Jay Kaeppel
Disclaimer: The data presented herein were obtained from various third-party sources. While I believe the data to be reliable, no representation is made as to, and no responsibility, warranty or liability is accepted for the accuracy or completeness of such information. The information, opinions and ideas expressed herein are for informational and educational purposes only and do not constitute and should not be construed as investment advice, an advertisement or offering of investment advisory services, or an offer to sell or a solicitation to buy any security.

