Everyone is familiar with the KISS acronym, which – as everyone knows, stands for “Keep It Simple Stupid”. Far fewer people are familiar the CISS acronym, which stands for “Clearly Insanely Stupidly Simple”. Which is what the “system” that follows qualifies as. The good news is that beyond being simple it has also been pretty darned effective over time.
The Large-Cap/Small-Cap Debate
If you search the web for info on large-cap stocks versus small-cap stocks you will come up with roughly 537 million possible results. It is quite likely that somewhere in there you will find a more effective method than that which follows. Still, that’s a lot of links to search through. So may try this out first.
Jay’s CISS Large-Cap/Small-Cap “System”
Here are the rules:
*If the S&P 500 Index outperforms the Russell 2000 Index for the year, then buy and hold the S&P 500 Index during the following year.
*If the Russell 2000 Index outperforms the S&P 500 Index Index for the year, then buy and hold the Russell 2000 Index during the following year.
Did I mention it was simple?
The Results
To measure results I am using monthly total return data for the S&P 500 Index and the Russell 2000 Index. We will look at performance for
*The System (as described above)
*The Opposite of the System (i.e., holding the worse performer from the pervious year)
*Splitting capital between S&P 500 and Russell 200 and rebalancing Jan.1 each year
Figure 1 displays the growth of $1,000 for each of the above starting on 12/31/1979.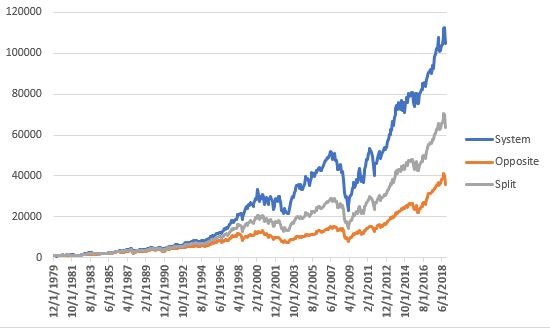
Figure 1 – Jay’s System versus Buy-and-Hold and the “Opposite” of the System; 12/31/1979-10/31/2018
For the record:
*The “System” gained +10,361%
*Splitting money between SPX and RUT on Jan 1 each year gained +6,272%
*Doing the “opposite” of the System gained +3,471%
Because this “System” is always fully invested in either the S&P 500 Index or the Russell 2000 Index, it takes its lumps in bear markets. So in 2008, for instance, it took a beating just like everything else. But that is the nature of “always fully invested in stocks” methods.
The key point is that in the end the CISS System made 1.65 times as much as “buy-and-hold” and 2.98 times as much as doing the “opposite of the System”.
Figure 2 displays the Year-by-Year results:
Column A = Year
Column B = SPX total annual return
Column C = RUT total annual return
Column D = Which index is held during that calendar year
Column E = Annual % gain(loss) for The System for that calendar year
Column F = Annual % gain(loss) from holding the “other” index
Column G = % gain(loss) from splitting $ evenly between SPX and RUT on January 1st
Column H = $1,000 using System becomes
Column I = $1,000 using the “Opposite” of the System becomes
Column J = $1,000 using Buy-and-Hold (and annual rebalance) becomes
| A | B | C | D | E | F | G | H | I | J |
| Year | SPX | RUT | Hold | System | Opposite | Split | System | Opposite | Split |
| 1979 | 18.6 | 43.1 | $1000 | $1000 | $1000 | ||||
| 1980 | 32.5 | 38.6 | RUT | 38.6 | 32.5 | 35.5 | 1,386 | 1,325 | 1,355 |
| 1981 | (4.9) | 2.0 | RUT | 2.0 | (4.9) | (1.4) | 1,414 | 1,260 | 1,336 |
| 1982 | 21.5 | 24.9 | RUT | 24.9 | 21.5 | 23.2 | 1,767 | 1,531 | 1,646 |
| 1983 | 22.6 | 29.1 | RUT | 29.1 | 22.6 | 25.8 | 2,282 | 1,877 | 2,072 |
| 1984 | 6.3 | (7.3) | RUT | (7.3) | 6.3 | (0.5) | 2,115 | 1,994 | 2,061 |
| 1985 | 31.7 | 31.0 | SPX | 31.7 | 31.0 | 31.4 | 2,786 | 2,613 | 2,708 |
| 1986 | 18.7 | 5.7 | SPX | 18.7 | 5.7 | 12.2 | 3,306 | 2,762 | 3,038 |
| 1987 | 5.3 | (8.8) | SPX | 5.3 | (8.8) | (1.8) | 3,480 | 2,519 | 2,984 |
| 1988 | 16.6 | 25.0 | SPX | 16.6 | 25.0 | 20.8 | 4,058 | 3,149 | 3,605 |
| 1989 | 31.7 | 16.3 | RUT | 16.3 | 31.7 | 24.0 | 4,717 | 4,147 | 4,469 |
| 1990 | (3.1) | (19.5) | SPX | (3.1) | (19.5) | (11.3) | 4,571 | 3,339 | 3,965 |
| 1991 | 30.5 | 46.0 | SPX | 30.5 | 46.0 | 38.3 | 5,964 | 4,877 | 5,481 |
| 1992 | 7.6 | 18.4 | RUT | 18.4 | 7.6 | 13.0 | 7,062 | 5,248 | 6,195 |
| 1993 | 10.1 | 18.9 | RUT | 18.9 | 10.1 | 14.5 | 8,395 | 5,777 | 7,092 |
| 1994 | 1.3 | (1.8) | RUT | (1.8) | 1.3 | (0.3) | 8,242 | 5,853 | 7,074 |
| 1995 | 37.6 | 28.5 | SPX | 37.6 | 28.5 | 33.0 | 11,339 | 7,519 | 9,409 |
| 1996 | 23.0 | 16.5 | SPX | 23.0 | 16.5 | 19.7 | 13,942 | 8,759 | 11,265 |
| 1997 | 33.4 | 22.4 | SPX | 33.4 | 22.4 | 27.9 | 18,594 | 10,717 | 14,404 |
| 1998 | 28.6 | (2.5) | SPX | 28.6 | (2.5) | 13.0 | 23,907 | 10,445 | 16,279 |
| 1999 | 21.0 | 21.3 | SPX | 21.0 | 21.3 | 21.2 | 28,938 | 12,665 | 19,722 |
| 2000 | (9.1) | (3.0) | RUT | (3.0) | (9.1) | (6.1) | 28,064 | 11,512 | 18,526 |
| 2001 | (11.9) | 2.5 | RUT | 2.5 | (11.9) | (4.7) | 28,762 | 10,143 | 17,656 |
| 2002 | (22.1) | (20.5) | RUT | (20.5) | (22.1) | (21.3) | 22,870 | 7,902 | 13,897 |
| 2003 | 28.7 | 47.3 | RUT | 47.3 | 28.7 | 38.0 | 33,677 | 10,168 | 19,173 |
| 2004 | 10.9 | 18.3 | RUT | 18.3 | 10.9 | 14.6 | 39,850 | 11,275 | 21,973 |
| 2005 | 4.9 | 4.6 | RUT | 4.6 | 4.9 | 4.7 | 41,665 | 11,829 | 23,013 |
| 2006 | 15.8 | 18.4 | SPX | 15.8 | 18.4 | 17.1 | 48,246 | 14,001 | 26,944 |
| 2007 | 5.5 | (1.6) | RUT | (1.6) | 5.5 | 2.0 | 47,490 | 14,770 | 27,473 |
| 2008 | (37.0) | (33.8) | SPX | (37.0) | (33.8) | (35.4) | 29,920 | 9,780 | 17,750 |
| 2009 | 26.5 | 27.2 | RUT | 27.2 | 26.5 | 26.8 | 38,050 | 12,368 | 22,510 |
| 2010 | 15.1 | 26.9 | RUT | 26.9 | 15.1 | 21.0 | 48,268 | 14,231 | 27,228 |
| 2011 | 2.1 | (4.2) | RUT | (4.2) | 2.1 | (1.0) | 46,252 | 14,531 | 26,947 |
| 2012 | 16.0 | 16.3 | SPX | 16.0 | 16.3 | 16.2 | 53,654 | 16,907 | 31,306 |
| 2013 | 32.4 | 38.8 | RUT | 38.8 | 32.4 | 35.6 | 74,484 | 22,383 | 42,452 |
| 2014 | 13.7 | 4.9 | RUT | 4.9 | 13.7 | 9.3 | 78,130 | 25,447 | 46,397 |
| 2015 | 1.4 | (4.4) | SPX | 1.4 | (4.4) | (1.5) | 79,211 | 24,324 | 45,694 |
| 2016 | 12.0 | 21.3 | SPX | 12.0 | 21.3 | 16.6 | 88,684 | 29,507 | 53,294 |
| 2017 | 21.8 | 14.6 | RUT | 14.6 | 21.8 | 18.2 | 101,674 | 35,949 | 63,015 |
| 2018 | 2.9 | (0.7) | SPX | 2.9 | (0.7) | 2.9 | 104,613 | 35,712 | 64,836 |
Figure 2 – Year-by-Year Results
Summary
So is this a great, world-beater “System.” Probably not. But it has managed to outperform buy-and-hold by a factor of 1.65-to-1 over the last 38 years.
And did I mention that it’s simple?
Jay Kaeppel
Disclaimer: The data presented herein were obtained from various third-party sources. While I believe the data to be reliable, no representation is made as to, and no responsibility, warranty or liability is accepted for the accuracy or completeness of such information. The information, opinions and ideas expressed herein are for informational and educational purposes only and do not constitute and should not be construed as investment advice, an advertisement or offering of investment advisory services, or an offer to sell or a solicitation to buy any security.


What if a 10 mo or other moving average is applied to the selected index – does it help or hurt?
Carl, a simple test using a 10-month MA versus SPX (SPX>10mo MA “In” stocks, SPX<10mo MA "Out" of stocks) gives mixed results. The equity curve is much smoother and the drawdowns are less, but returns are below buy-and-hold. Still, it is a good thought and an area for further exploration. Jay