The question on many investors’ minds is “are we in a bond bear market?” Given that long-term treasuries have lost roughly 17% since July of 2016 it is a fair question.
The main model that I use is still bearish on bonds (more on this topic below). Still, there are a few potential “lights at the end of the bond tunnel” – at least potentially in the near-term.
Long-Term Rates
My mega long-term “fail-safe” bond trend indicator appears in Figure 1. It is the yield on 30 year treasuries (ticker TYX – which is multiplied by 10 for some unknown reason) with a 120-month exponential moving average.
 Figure 1 – 30-Yr. Treasury yields (Ticker TYX) with 120-month average (Courtesy AIQ TradingExpert)
When the day comes that TYX breaks out above the 120-month moving average I for one will officially designate the great bond bull market as “over.” And that day is coming. But for what it’s worth – it’s not quite here yet.
Metals Positive for Bonds
In this article I wrote about a bond timing model that uses the relationship between gold and copper. Like a lot of timing models of all stripes it does a good job of differentiating good times for bonds from bad times for bonds, but is very far from perfect.
It goes like this:
A = Gold / Copper
B = 30-day moving average of A
C = 80-day moving average of A
D = B – C
If D > 0 = Bullish for bonds*
If D < 0 = Bearish for bonds*
*- with a 1-day lag
This indicator flipped to bullish at the close on 2/7/18 after being bearish since 7/10/2017.
Figure 2 displays the action of ticker TLT since the last “sell” signal in July 2017. As you can see, in the end it ended up being “correct” as TLT was lower on 2/7/18 than it was on 7/10/17. But that was not the case until the last week or so. So for most of the time during this bearish period TLT traded higher.  Figure 2 – Ticker TLT with recent Jay’s Metal Model signals (Courtesy AIQ TradingExpert)
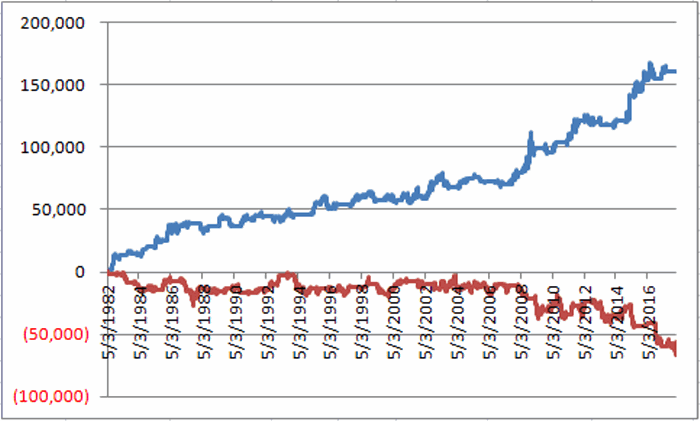
What is most important however is to focus on the long-term results. In Figure 2 the blue line depicts the growth of equity achieved by holding long 1 t-bond futures contract ONLY when the model is bullish while the red line depicts the growth of equity achieved by holding long 1 t-bonds futures contract ONLY when the model is bearish (red line).
 Figure 2 – T-bond futures $ gain/loss when Jay’s Metal Model is bullish (blue line) versus when model is bearish (red line)
The long-term difference in performance is fairly obvious. That being said it should also be noted that the blue line is by no means a series of straight line advances, i.e., there is no guarantee that this latest bullish signal will prove fortuitous, especially given that we may be transitioning from a long-term bond bull market to a long-term bond near market.
One More Possible Piece of Good News
In this article I applied an indicator I originally learned from Tom McClellan at http://www.mcoscillator.com to weekly TLT. This indicator looks at the number of times TLT has been up minus the number of times down over the past 20 weeks. Very often a drop to -2 or below followed by an upside reversal of 2 points (i.e., it drops to -2 then subsequently rises to 0, or drops to -3 then rises to -1 and so on) has presaged a favorable up move in bonds. This indicator applied to TLT recently fell to -2 and may flash a favorable signal soon (please note that it HAS NOT given a buy signal yet and that it could take several weeks before it does).
 Figure 3 – Weekly TLT with UpDays20 Indicator (Courtesy AIQ TradingExpert)
One Piece of “Still Bad News”
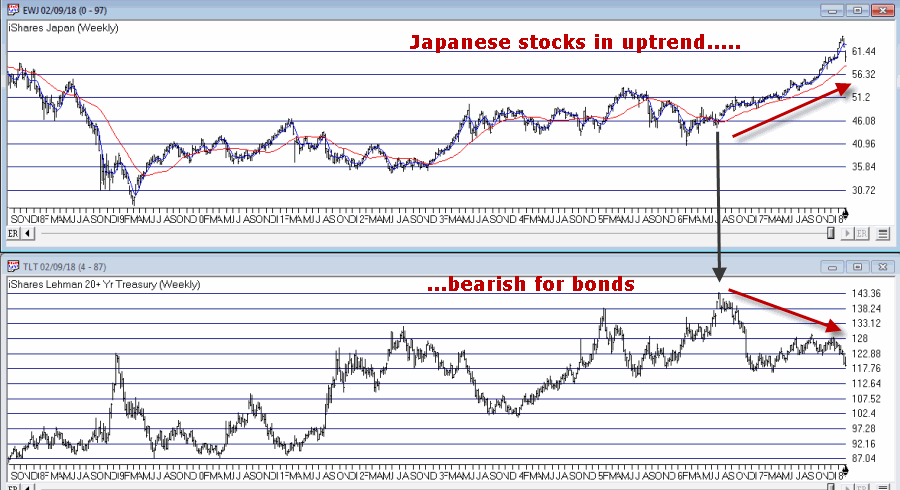
In this article I wrote about one of the main bond models I use that uses the trend in Japanese stocks to trade bonds inversely, i.e., if Japanese stocks are bearish it is bullish for bonds and vice versa. I use a 5-week and 30-week moving average to quantify Japanese stocks as “bullish” or “bearish”.
In Figure 4 when the blue line in the top clip is above the red line this is considered bearish for bonds and when the blue line is below the red line it is considered bullish for bonds. For now the blue 5-week average line is still well above the red 30-week average, so this indicator still designates the trend for bonds as “bearish”.
 Figure 4 – Ticker TLT tends to trade inversely to ticker EWJ (Courtesy AIQ TradingExpert)
Summary
So are bonds due to rally? Well, it seems like at least a short-term bounce could be in the offing. That being said, with bonds breaking down sharply at the moment, 1) this “idea” is geared for “traders” who are not afraid of (and are unacquainted with) taking risks, 2) it might make sense to wait for the UpDays20 indicator discussed above to tick higher by two points – which could take up to several weeks to play out – before “taking the plunge.”
As always I am not “recommending” anything, just highlighting what I see. For longer-term investors the “Boring Bond Index” bond strategy I wrote about here remains a viable long-term approach to bond investing.
Jay Kaeppel
Disclaimer: The data presented herein were obtained from various third-party sources. While I believe the data to be reliable, no representation is made as to, and no responsibility, warranty or liability is accepted for the accuracy or completeness of such information. The information, opinions and ideas expressed herein are for informational and educational purposes only and do not constitute and should not be construed as investment advice, an advertisement or offering of investment advisory services, or an offer to sell or a solicitation to buy any security.

