The setup is as old as the markets themselves. The price for a given security – be it a stock, an index, a commodity, whatever – moves sideways, first in a fairly wide range and then narrowing more and more into a tighter range. If options are traded on that security, typically implied volatility for those options declines to a very low level. Then, just when it seems that that security will never stop drifting sideways the breakout comes.
In many cases – though most certainly not in all – the price move following the breakout can be surprisingly large. These situations offer traders some potentially spectacular profit potential.
How to play these situations is a whole other topic.
Anticipation versus Reaction
Some traders will wait for a breakout and then “react” by trading in the direction of the breakout – long for an upside breakout or short for a downside breakout. The disadvantage here is that:
1) In many cases you may miss a significant price move before getting in, and/or;
2) Occasional false breakouts are a fact of trading life and can lead to quick whipsaws and a need to act cut your loss quickly (and in all candor, painfully).
Anticipating a breakout can lead to large profits. The catch is that one typically needs to pick the right direction in order to profit. This disadvantage may at times be mitigated via the use of options. Let’s consider a current example – the silver market.
Silver Futures and ETF Ticker SLV
As you can see in Figure 1 – which displays the front month in silver futures going back to the 1970’s – silver has a long history of “contracting” and then “expanding”. Figure 1 – Monthly Silver Futures – a History of Contraction and Expansion (Courtesy ProfitSource by HUBB)
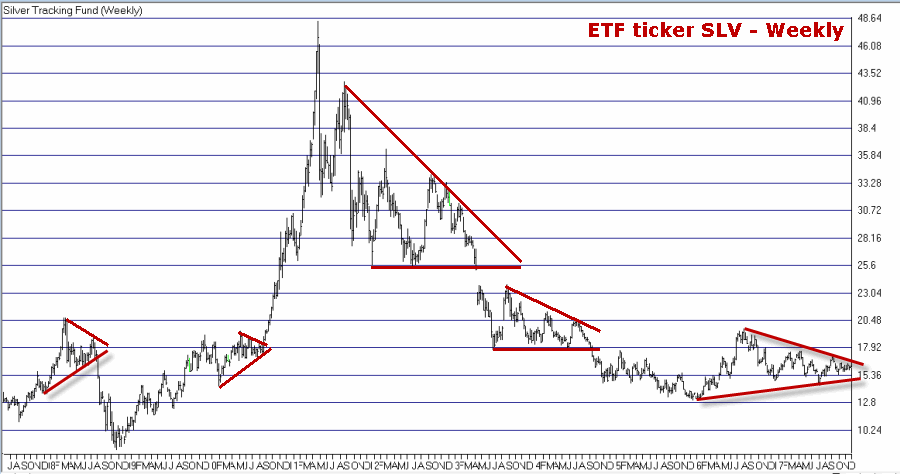
Ticker SLV is an ETF that tracks the price of silver futures. Figure 2 displays a weekly chart for ticker SLV. You see the same type of “contraction” and “expansion” – including a significant contraction unfolding in the latest fortnight. Figure 2 – Ticker SLV Weekly Chart (Courtesy AIQ TradingExpert)
So where to from here? Will SLV ultimately break lower or higher? I have to go with my usual answer of – “it beats me.” Still, for what it is worth, in Figure 3 we see that the weekly and daily Elliott Wave counts (generated using an objective algorithm built into ProfitSource by HUBB software) for ticker SLV are both suggesting that a move to the upside may be in the offing. The weekly chart in the top clip of Figure 3 suggests that a weekly 5 wave down pattern may have been completed (which in “Elliott Speak” suggests that a 5 wave up pattern should follow next). The daily chart in the bottom clip suggests that we may already be in a daily Wave 4 buy for SLV. Figure 3 – Weekly and Daily Elliott Wave counts for ticker SLV (Courtesy ProfitSource by HUBB)
So for now we will lean towards playing the upside – with an eye on mitigating downside risk as much as possible.
Implied Option Volatility is Low
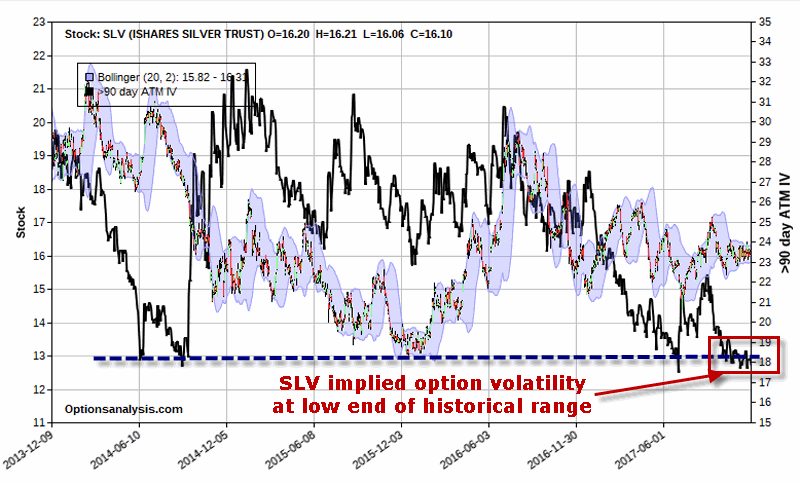
In Figure 4 we see 1000 days of SLV price and implied volatility data. Clearly implied volatility is presently trading at the low end of its historical range. Figure 4 – Implied volatility for SLV options at the low end of the historical range (Courtesy www.OptionsAnalysis.com)
Why does this matter? Two reasons:
1) It tells us that the amount of time premium built into the price of SLV options is presently very low on a historical basis – i.e., SLV options are “cheap”, so “buying premium” offers a possible “edge”.
2) We might be able to enter a position whose reward/risk ratio can actually improve after the position is entered – if implied volatility rises after we enter the trade.
An Example Trade
Given everything we have seen so far:
*The propensity for silver to contract over a period of weeks or months and then move sharply in price over a subsequent period of weeks or months
*The current “contracting” status of ticker SLV
*The fact that weekly and daily Elliott Wave counts appear to be pointing to the upside
*The current low level of implied volatility for SLV options
Let’s consider a position that might allow us to take advantage if things play out properly – without assuming tons of risk.
Our example trade involves:
*Selling 1 SLV June 2018 11 call @ 5.25
*Buying 5 SLV June 2018 16 calls @ 1.11
This strategy is referred to as a “Call Backspread”. In essence we are selling 1 in-the-money call option and using the proceeds ($525) to pay for (most of) our 16 strike price calls (cost = 1.11 x 100 x 5 = $555).
 Figure 5 – SLV backspread particulars (Courtesy www.OptionsAnalysis.com)
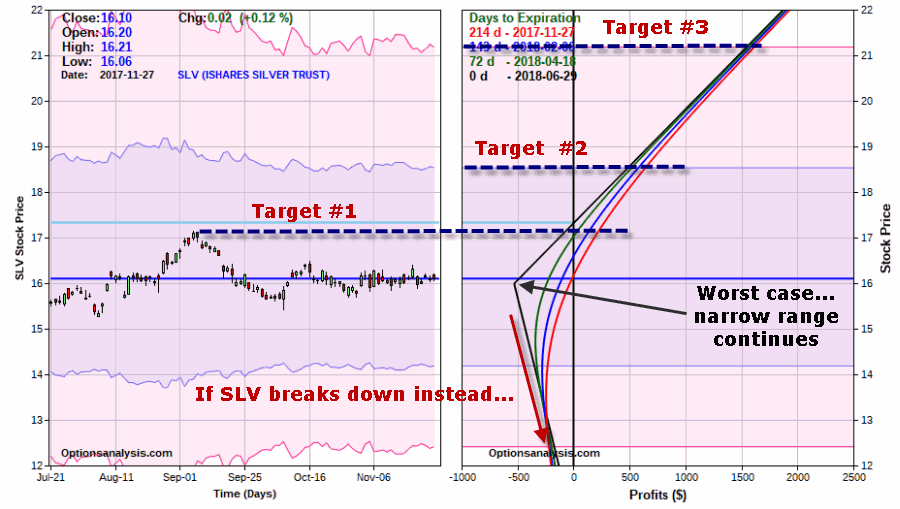
 Figure 6 – SLV backspread risk curves (Courtesy www.OptionsAnalysis.com)
Why this trade? With the caveat that no implication is being made that this is the “best” trade firmly in mind, this trade is highlighted because:
*There are 200 days left until expiration – so there is plenty of time for “something to happen” with the price of SLV.
*The maximum risk (and the cost to enter the position) is $530. However, this maximum loss would only occur if we were still holding this position on 6/29/2018 AND SLV closed at on that day at exactly $16 a share.
*Also, longer term options are more sensitive to changes in implied volatility. So if implied volatility for SLV options does move higher in the months ahead that will serve to inflate the return on this trade (NOTE: in the upper right hand of Figure 4 we see that this position has a “Vega” of $22.84. What this means is that if implied volatility rises 1 percentage point then this trade will gain $22.84 based solely on a change in volatility. Our hope is to get higher SLV prices AND higher implied option volatility).
As you can see in Figure 6:
*This position has unlimited profit potential if in fact SLV does break out to the upside.
*If we are exactly wrong and SLV breaks to the downside our loss actually shrinks the further SLV falls.
*Our worst case scenario is if SLV remains unchanged between now and June 2018 option expiration. This is OK because the impetus for the trade in the first place is the belief that SLV is setting up for a breakout somewhere in the months ahead – so we are in essence deeming “remaining unchanged” as our least likely scenario.
Summary
Is the SLV trade highlighted herein “guaranteed” to generate a profit. Absolutely not! In fact, we can’t even say that a profit is likely. In the end, this particular position is nothing more than a speculative bet on higher prices (and possibly higher volatility) for SLV.
The bottom line: If SLV fails to move to the upside this trade will lose money.
But please remember that I am NOT “recommending” this trade. It is simply an example. of one way to play a given set of circumstances. What is important is to consider the thought process behind choosing this particular position.
Jay Kaeppel
Disclaimer: The data presented herein were obtained from various third-party sources. While I believe the data to be reliable, no representation is made as to, and no responsibility, warranty or liability is accepted for the accuracy or completeness of such information. The information, opinions and ideas expressed herein are for informational and educational purposes only and do not constitute and should not be construed as investment advice, an advertisement or offering of investment advisory services, or an offer to sell or a solicitation to buy any security.

