It is not a little known fact that the stock market has showed a tendency to perform well during the end-of-year “Holiday Season”. How well? Let’s take a look.
The Test
Let’s first define “Holiday Season” as it relates to the stock market. We will focus our attention on the following period:
*From the close on the Friday before Thanksgiving through the close on the last trading day of the year.
Figure 1 displays the growth of $1,000 invested in the Dow Jones Industrials Average only during this holiday season time period starting in 1942.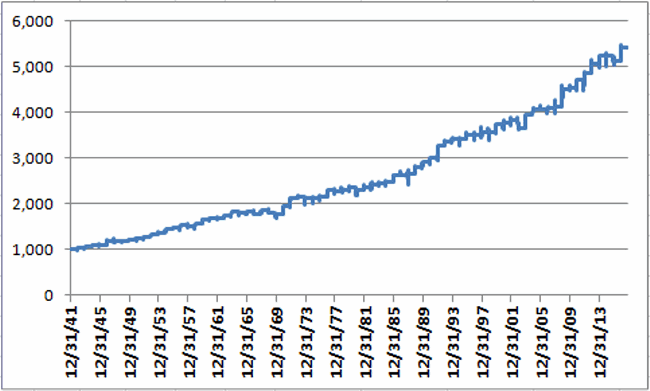 Figure 1 – Growth of $1,000 invested in Dow Industrials ONLY from close on Friday before Thanksgiving through close on last trading day of the year; 1942-2016
For the record:
*# of times UP = 60 (80% of the time)
*# of times DOWN =15 (20% of the time)
*Average UP% Gain= +3.3%
*Average DOWN% Loss = (-1.8%)
*#of Rolling 5-year periods showing a gain = 69 (97% of the time)
*# of Rolling 5-year periods showing a loss = 2 (3% of the time)
*#of Rolling 10-year periods showing a gain = 66 (100% of the time)
*# of Rolling 10-year periods showing a loss = 0 (0% of the time)
The good news is the long-term consistency of returns (80% of all 1-yr, 97% of all 5-yr. and 100% of all 10-yr. periods show a gain)
The bad news is that this is still no “sure thing” as 15 times in 75 years – or 20% of the time – this supposedly “bullish” seasonal period showed a loss. The 5 worst losing periods were:
2002 (-5.3%)
1966 (-2.9%)
1969 (-2.8%)
1980 (-2.6%)
1968 (-2.4%)
While these losses seem small, it should be noted that a “mere” -2.4% decline from current levels would knock roughly 560 points off of the Dow. A -5.3% declines would total roughly 1,250 Dow points. That would not exactly qualify as “wonderful”.
Figure 2 displays the year by year results.
| Year | Seasonal %+(-) |
| 1942 | 3.5 |
| 1943 | 2.2 |
| 1944 | 4.3 |
| 1945 | 0.3 |
| 1946 | 7.3 |
| 1947 | (0.6) |
| 1948 | (0.1) |
| 1949 | 3.4 |
| 1950 | 1.6 |
| 1951 | 3.2 |
| 1952 | 4.5 |
| 1953 | 1.8 |
| 1954 | 7.0 |
| 1955 | 1.1 |
| 1956 | 4.7 |
| 1957 | (1.6) |
| 1958 | 4.3 |
| 1959 | 5.3 |
| 1960 | 2.0 |
| 1961 | 0.3 |
| 1962 | 2.6 |
| 1963 | 4.1 |
| 1964 | (1.9) |
| 1965 | 1.7 |
| 1966 | (2.9) |
| 1967 | 5.2 |
| 1968 | (2.4) |
| 1969 | (2.8) |
| 1970 | 10.2 |
| 1971 | 9.8 |
| 1972 | 1.5 |
| 1973 | (1.4) |
| 1974 | 0.2 |
| 1975 | 1.4 |
| 1976 | 5.9 |
| 1977 | (0.5) |
| 1978 | 0.9 |
| 1979 | 2.3 |
| 1980 | (2.6) |
| 1981 | 2.6 |
| 1982 | 2.5 |
| 1983 | 0.6 |
| 1984 | 3.2 |
| 1985 | 5.6 |
| 1986 | 0.1 |
| 1987 | 1.3 |
| 1988 | 5.1 |
| 1989 | 3.8 |
| 1990 | 3.6 |
| 1991 | 9.2 |
| 1992 | 2.3 |
| 1993 | 1.6 |
| 1994 | 0.5 |
| 1995 | 2.5 |
| 1996 | (0.4) |
| 1997 | 1.8 |
| 1998 | 0.2 |
| 1999 | 4.5 |
| 2000 | 1.5 |
| 2001 | 3.2 |
| 2002 | (5.3) |
| 2003 | 8.6 |
| 2004 | 3.1 |
| 2005 | (0.5) |
| 2006 | 1.0 |
| 2007 | (1.8) |
| 2008 | 9.1 |
| 2009 | 1.1 |
| 2010 | 3.3 |
| 2011 | 3.6 |
| 2012 | 3.2 |
| 2013 | 3.2 |
| 2014 | 0.1 |
| 2015 | (2.2) |
| 2016 | 5.9 |
Figure 2 – % gain(loss) for Dow Jones Industrials Average during 3 Trading Days prior to Thanksgiving through December 31st (Dow Jones Industrials Average)
Jay Kaeppel
Disclaimer: The data presented herein were obtained from various third-party sources. While I believe the data to be reliable, no representation is made as to, and no responsibility, warranty or liability is accepted for the accuracy or completeness of such information. The information, opinions and ideas expressed herein are for informational and educational purposes only and do not constitute and should not be construed as investment advice, an advertisement or offering of investment advisory services, or an offer to sell or a solicitation to buy any security.

