The support and resistance levels and the trends (or lack thereof) that a trader sees on a chart can vary greatly depending on the time period covered in the chart. In other words, a 1-minute bar chart can be extremely useful to a very short-term trader, but will present a very different perspective than say a weekly chart for the same security. The point is simply that there is no one best timeframe for anything.
(See also How NOT to Hedge a Long-Term Rise in Interest Rates)
That being said, sometimes when you are simply trying to gain “perspective”, a really long-term approach can be useful. To wit, consider 10-year treasury bonds. Using the data found at this link: (https://fred.stlouisfed.org/series/IRLTLT01USM156N)
I added a 125-month exponential moving average (calculations below) to gain a very long-term perspective regarding interest rate trends and their current state. Remember that this is not a “timing system” but rather more of a “confirmation system” that will never pick a top or bottom but (as we will see) can be useful in identifying the overall long-term trend in 10-year treasury bond yields.
Calculations for the 125-month exponential moving average (EMA)
*Multiplier2 = 2 / (moving average length + 1)
*Multiplier 1 = (1 – Multiplier2)
*Calculation1 = (Previous Moving Average * Multiplier1)
*Calculation2 = (Current Monthly Yield * Multiplier2)
*New Moving Average = Calculation1 + Calculation2
Are we having fun yet?
For example, for data point 03-01-2017:
*Multiplier2 = 2 / (125 + 1) = 0.0159
*Multiplier 1 = (1 – Multiplier2) = 0.9841
*Calculation1 = (Previous Moving Average * Multiplier1) = (2.8424 * 0.9841) = 2.7973
*Calculation2=(Current Monthly Yield * Multiplier2)=(2.48 * 0.0159) =0.0394
*New Moving Average=Calculation1+Calculation2=2.7973 + 0.0394 = 2.8367
So the latest data point is 2.48% and the latest 125-month EMA is 2.8367%
Long-Term Trend-Following Rules:
*If the latest monthly yield value is BELOW the New Moving Average then 10-Year bond yields are considered to be in a downtrend, i.e., Bonds are BULLISH
*If the latest monthly yield value is ABOVE the New Moving Average then 10-Year bond yields are considered to be in an uptrend, i.e., Bonds are BEARISH
Figure 1 below displays the long-term chart
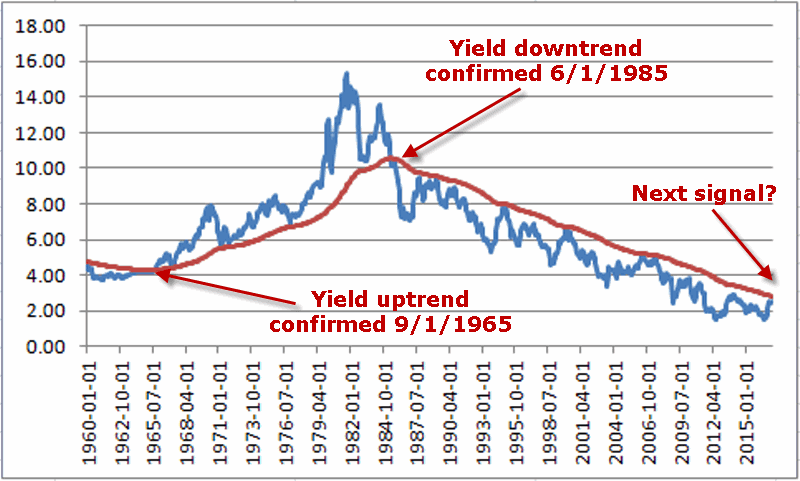 Figure 1 – 10-Year Treasury Yields (blue line) with 125-month exponential moving average (red line); 1960-2017
According to this method, 10-year bonds were:
*Bullish starting on 1/1/1960 with yields at 4.72%
*Bearish starting on 9/1/1965 with yields at 4.29%
*Bullish starting on 6/1/1985 with yields at 10.16%
As of the latest data point (3-01-2017) the 10-year yield was 2.48% and the 125-month EMA was at 2.8367%. Since the current data point is still below the moving average the trend in rates is still considered “down”, therefore there still is no bearish reversal confirmation from this particular indicator.
When the 10-year yield finally rises back above the 125-month EMA it will (likely) confirm a reversal in fortune for bonds back to the bearish side.
(See also More on Months to Beware of in 2017)
Summary
My own primary 30-year bond trend method has been bearish on 20-year bonds since 6/10/2016 (as I last highlight here).
Still, a true reversal in the trend of interest rates will not (at least in my market-addled mind) be confirmed until the 10-year yield moves back above its 125-month EMA.
Jay Kaeppel
Disclaimer: The data presented herein were obtained from various third-party sources. While I believe the data to be reliable, no representation is made as to, and no responsibility, warranty or liability is accepted for the accuracy or completeness of such information. The information, opinions and ideas expressed herein are for informational and educational purposes only and do not constitute and should not be construed as investment advice, an advertisement or offering of investment advisory services, or an offer to sell or a solicitation to buy any security.

