T-Bonds have had a heck of a run. Whether you are talking about the last 6 months, the last 5 years or the last 3 and half decades, bond prices have a come a long way. At the moment t-bonds are threatening to break out and run again to the upside. Given that my crystal ball broke a long time go and that I am not very good at predictions, I am not about to say anything stupid like “this is the top”, or “sell everything” (in terms of bond holdings).
But I am reasonably good at weighing potential risk versus reward. Given this – while I am not making a specific recommendation – it may be possible to play the bearish side of bonds in the very short-term. But first, something completely illogical
Japanese Stocks vs. Bonds
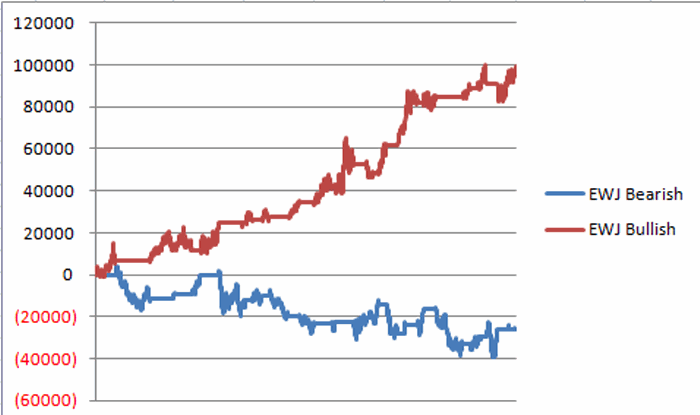
I have written in the past about the long-term inverse relationship between Japanese stocks and long-term U.S. treasury bonds (no, seriously). For the record the crude “timing” method that I use just gave a “sell” signal for bonds. Also for the record, the model I use is far from perfect so the fact that it just issued a bearish signal doesn’t necessarily mean that bonds are sure to take in the near future. Still, Figure 1 displays the equity curve for holding long one t-bond contract during those times when the model was bullish versus when the model was bearish since 1997. Figure 1 – Long 1 T-bond futures if Jay’s EWJ indicator is bullish (red) or bearish (blue); 12/31/1997-present
Far from perfect but clearly there seems to be something “there”.
Figure 2 displays the latest weekly bar chart for ticker EWJ (which tracks the Japanese stock market). A sell signal for t-bonds occurred when the 5-week MA rose above the 30-week MA as of 6/10/16. Figure 2 – Weekly ticker EWJ with 5-week and 30-week moving averages (Courtesy AIQ TradingExpert)
Current Bond Picture
In Figure 3 you can see pretty much whatever you want to see. Some will see a bond market that is breaking out to the upside (and with rates around the world trending toward negative numbers, why not?). Others may see a market that is extremely overbought short-term, is struggling to move past one resistance level and has another significant resistance level looming at $138.50. Figure 3 – What do you see in TLT? (Courtesy AIQ TradingExpert)
So based on Figures 1, 2 and 3 should we:
*Do nothing?
*Enter a bullish position to profit from a potential upside breakout?
*Sell short every t-bond futures contract we can get our hands on?
*Or something else?
Let’s consider each more closely.
Do Nothing
That is always the easiest (and lowest risk) approach. It would be perfectly logical to remain patient here and wait to see if bonds breakout to the upside or bump solidly against resistance before deciding on a course of action.
Enter a bullish position to profit from a potential upside breakout
A trader looking for an upside breakout might consider the example bull call spread shown in Figure 4.  Figure 4 – Aug TLT 135-140 Bull Call Spread (Courtesy www.OptionsAnalysis.com)
This position risks $182 with a maximum profit potential of $318 if TLT is at or above 140 by August 19th.
Sell short every t-bond futures contract we can get our hands on?
If one truly believes that the 138.50 resistance level will hold and that “this is the top” for bonds then this strategy might make sense. It is also a risky strategy and not “my cup of tea”. So I will leave this idea alone.
Something Else?
If your outlook is “Given the sell signal from respectable long-term indicator, the fact that t-bonds are very overbought right now, and there is another key resistance level above, is it possible that t-bonds will pause here for a little while”, then you might consider the following example trade.
*Sell 3 July Week 1 TLT 137 call options @ $1.50
*Buy 3 July Week 1 TLT 145 call options @ $0.19
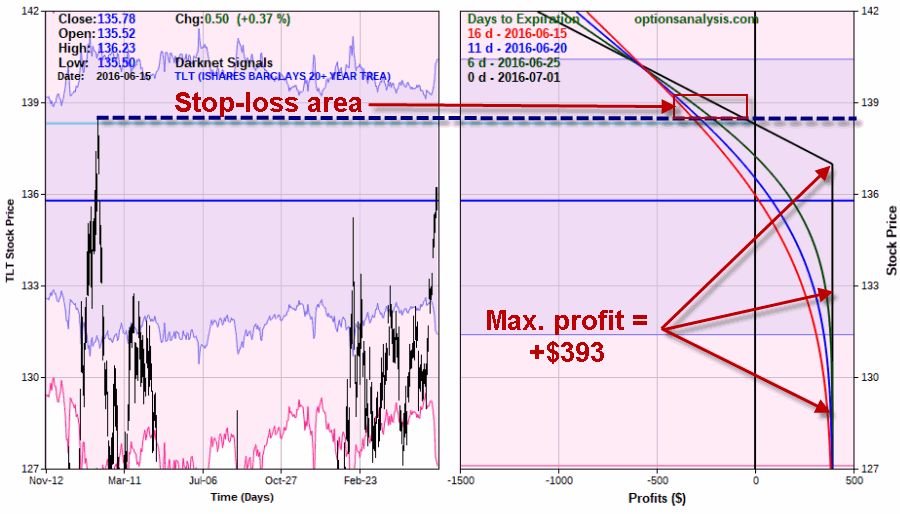
For planning purposes we will resolve to exit this trade if TLT moves above the previous high of $138.50 established on 1/30/2015. We might use a stop-loss point of $138.50 to $138.80 or TLT shares. The trade particulars appear in Figures 5 and 6. Figure 5 – TLT July Weeek 1 bear call credit spread (Courtesy www.OptionsAnalysis.com)
 Figure 6 – TLT July Weeek 1 bear call credit spread risk curves (Courtesy www.OptionsAnalysis.com)
Under this scenario this trade will:
*Make money if TLT remains below $138.31 for the next 16 days.
*Earn the maximum profit of $393 if TLT is below $137 at expiration (July 1st)
*Lose somewhere between -$150 to $-360 if TLT hits $138.80 prior to expiration (depending on how soon the stop-loss price is hit) and we stop ourselves out.
Summary
The trades above are not recommendations. The bull call spread will lose money if t-bonds fail to rally between now and 8/19. The bear call credit spread serves as an example of one way to use options to potentially make money if an overbought security “cools off” for a short period of time. For the record, I got burned on this type of trade recently (here and here), so one might be hesitant to “touch the hot stove” again. But that is exactly the wrong approach to trading. Each opportunity is its own independent event and what happened “last time” should not color one’s thinking when evaluating the next opportunity.
So will this example get torched like the last one? It’s possible.
Hence the reason for a stop-loss order.
Jay Kaeppel

